AI Analysed 5 Tactical Themes from the Goal Situation Data of 2026 FIFA World Cup
AI Analysed 5 Tactical Themes from the Goal Situation Data of 2026 FIFA World Cup
I am a lazy guy. So I let AI analyse the data.
In this article, 5 tactical considerations of goal scoring patterns are going to be analysed and summarised by one of the most advanced AI services, Claude.
The topic is to find out what kind of situation was the most dangerous and actually led to the goals. In recent years, many teams and managers have shown their focus on build up or high pressing. However, if these phases don’t generate goals, it is a waste of time, isn’t it? This is my assumption and let’s see how Claude answered this question.
From here, everything is written AI.
Breaking down all 308 goals by country, round, time period and situation to work out how this tournament’s goals were actually built, across five different angles.
308 total goals 48 teams 7 situation types 104 total matches
Topic 1: The Anatomy of a Goal — Possession, Set Pieces and Counter-Attacks
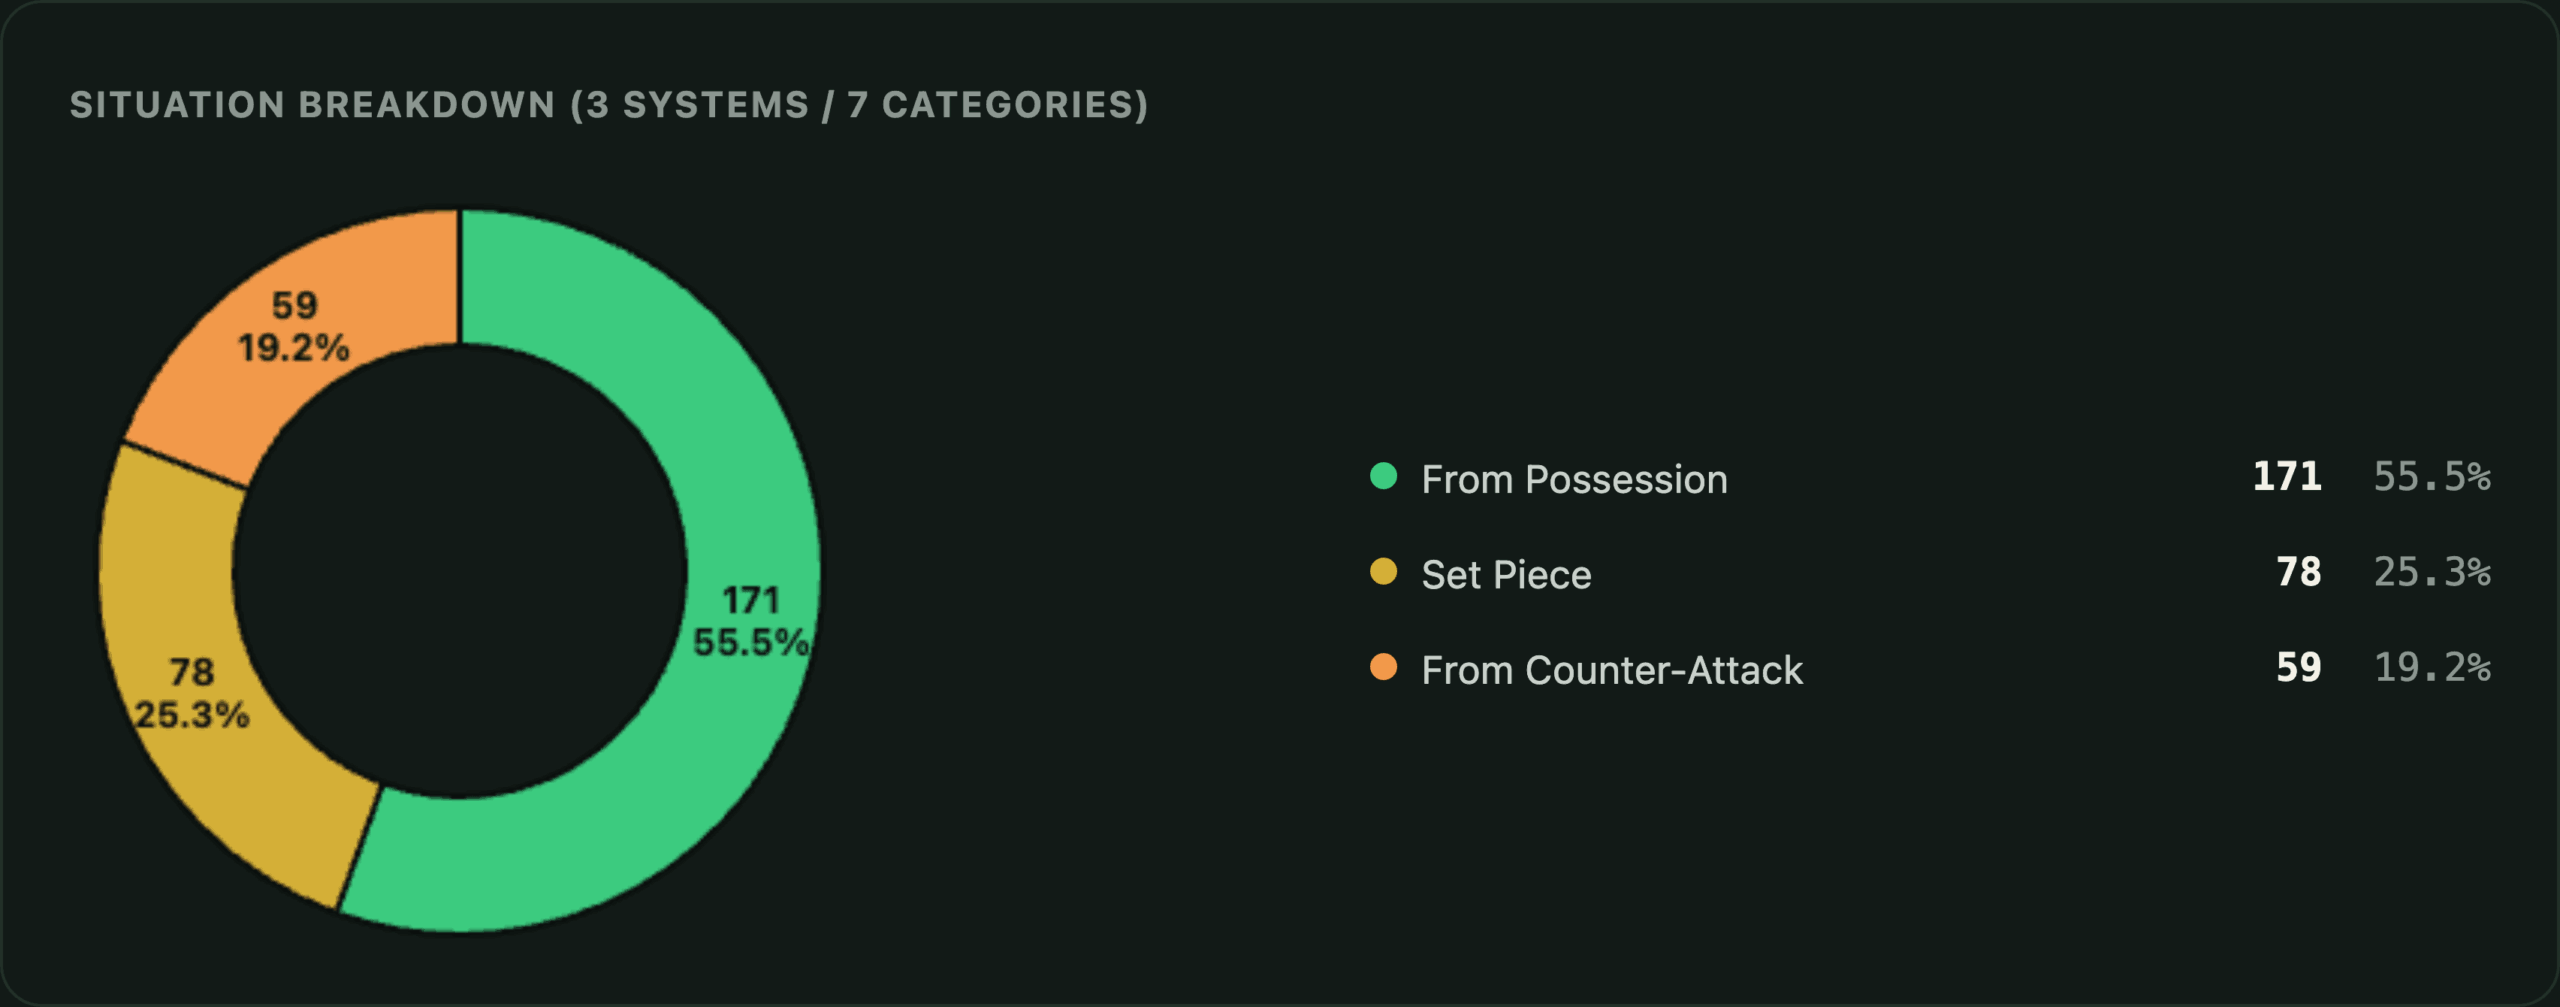
Start by splitting the 308 goals scored this tournament into three broad systems: “From Possession”, covering build-up play, progression up the pitch, and attacks broken down in the final third; “Set Piece”, covering corners, free kicks and penalties; and “From Counter-Attack”, where the goal originated directly from a defensive situation — high press, mid press, or a low block.
The split works out to 171 goals from possession (55.5% of the total), 78 from set pieces (25.3%), and 59 from counter-attacks (19.2%). Roughly a 5.5:2.5:2 ratio — more than half of this tournament’s goals came from organised, sustained attacking play, a quarter from set pieces, and a fifth from teams turning a defensive situation directly into a goal.
Zoom in to the full seven categories and Final Third Attacking (breaking down the opposition in the final third) stands out on its own with 113 goals — 36.7%, the single largest category by some distance. Set pieces follow at 25.3%, and those two categories alone account for 62% of every goal scored. The defensive categories, by contrast, are spread thin — Final Third Defending, High Press and Middle Press each sit in single digits (6.8%, 6.5% and 5.8% respectively), which suggests goals born from defensive situations aren’t tied to any one pressing style; they come from several different defensive set-ups fairly evenly.
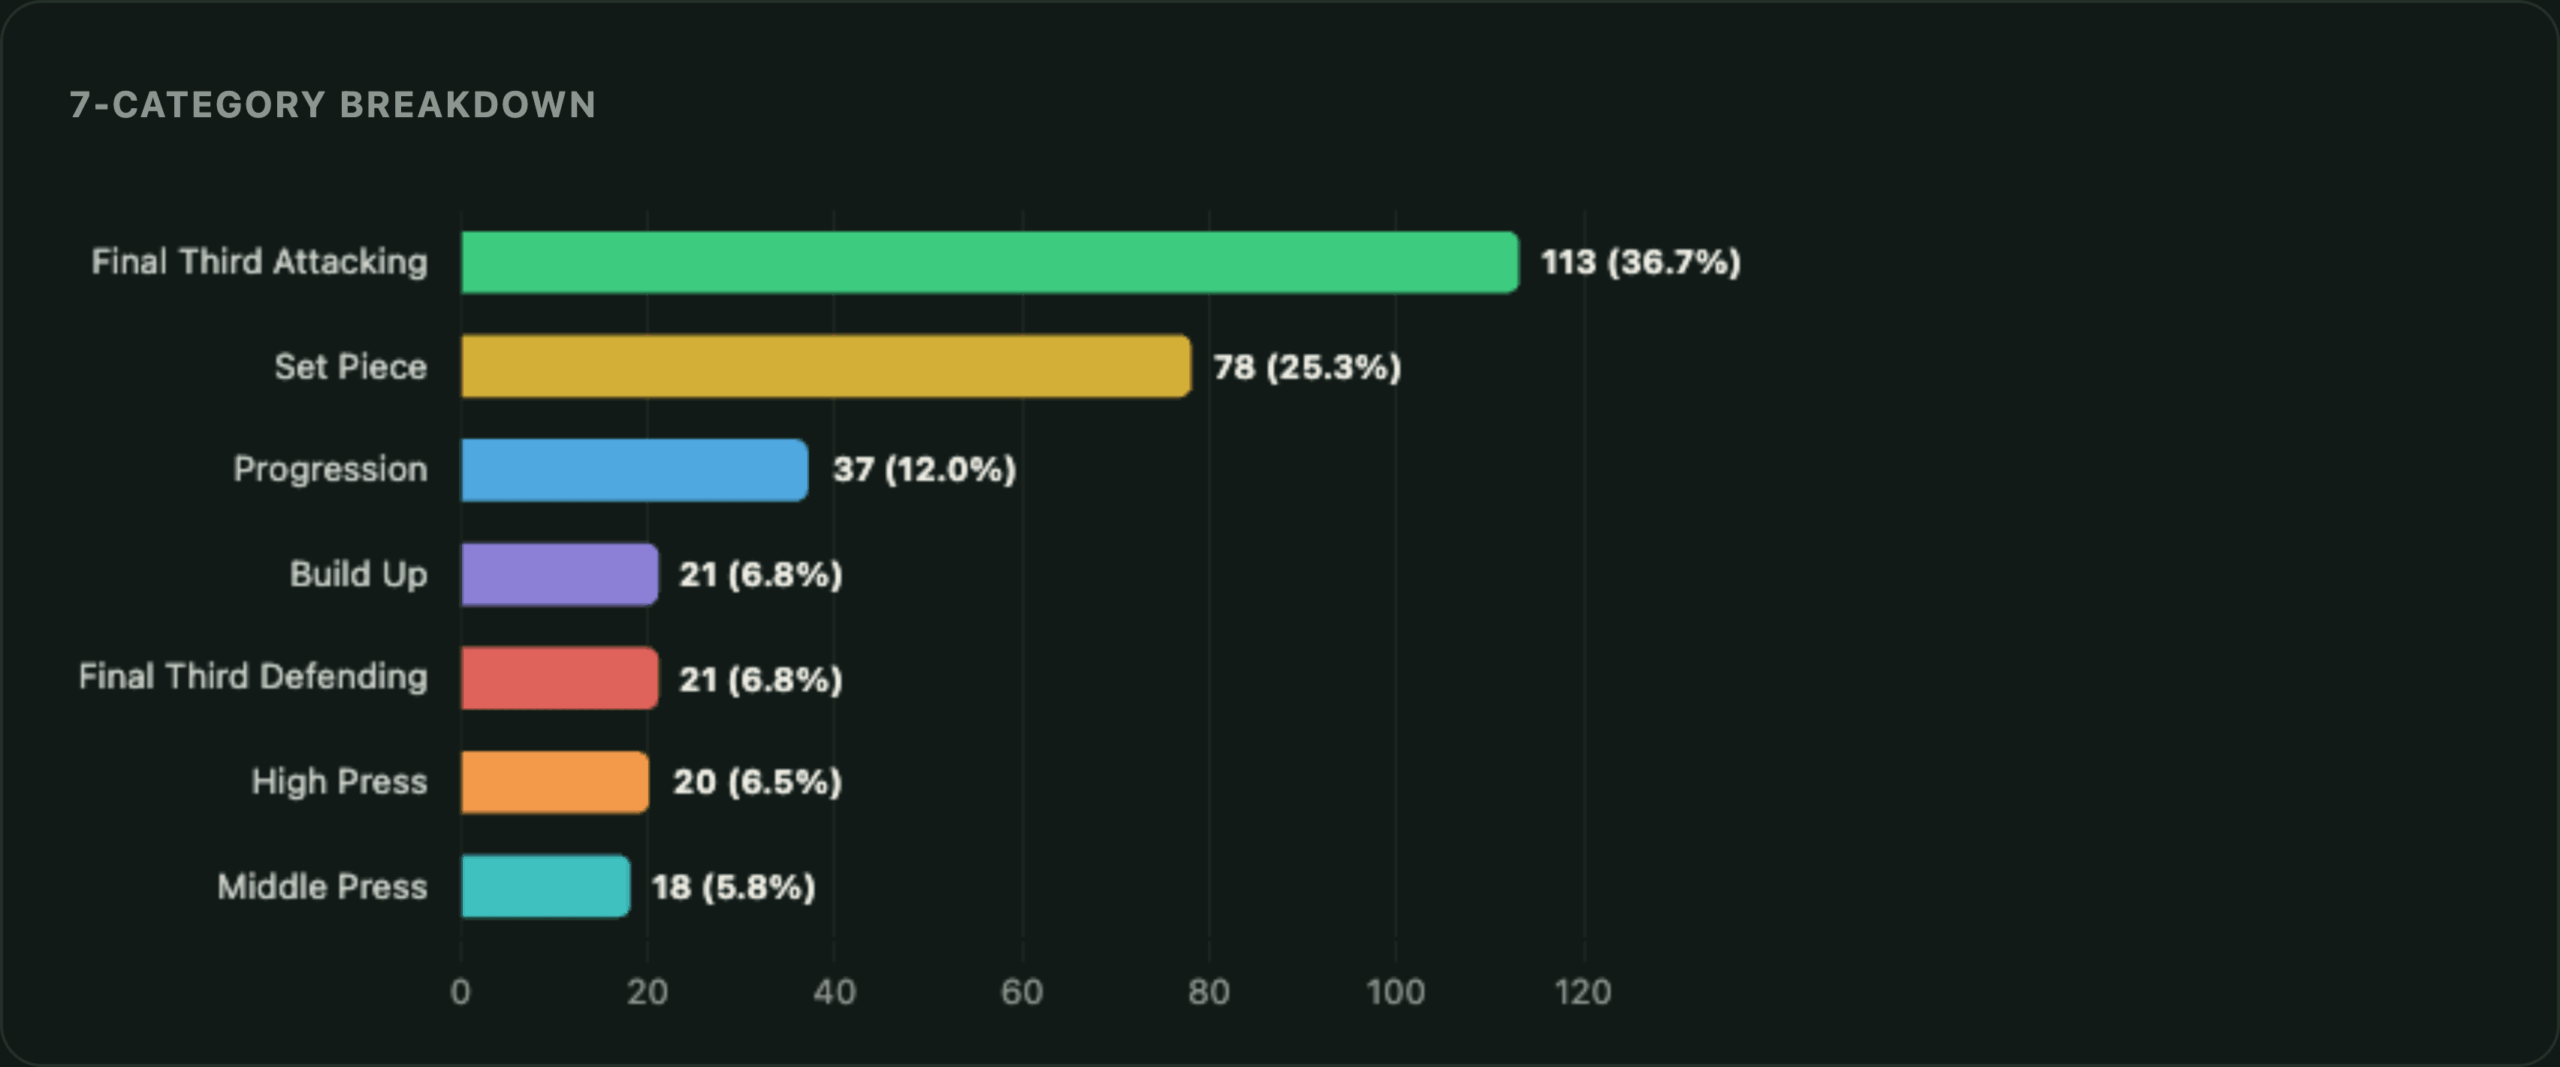
An unexpected finding: compare the Group Stage (Possession 55.8% / Set Piece 25.1% / Counter 19.1%) with the knockout rounds as a whole (Possession 54.8% / Set Piece 25.8% / Counter 19.4%) and the three-way split barely moves. The tidy story that “knockout football gets decided by set pieces” doesn’t hold up at this level, at least. Round by round, though, there’s a lot more movement underneath the surface — that’s the subject of Topic 3.
Topic 2: How the Character of Goals Shifts Through the Match
Break goals down into 15-minute windows and one stands out immediately: 81 goals (26.3%) came after the 76th minute. That’s more than double the 0-15 minute window (39 goals) or the 16-30 minute window (33 goals), and more than any other slice of the match. On the face of it, this looks like the familiar cliché — legs tire, gaps open up late on.
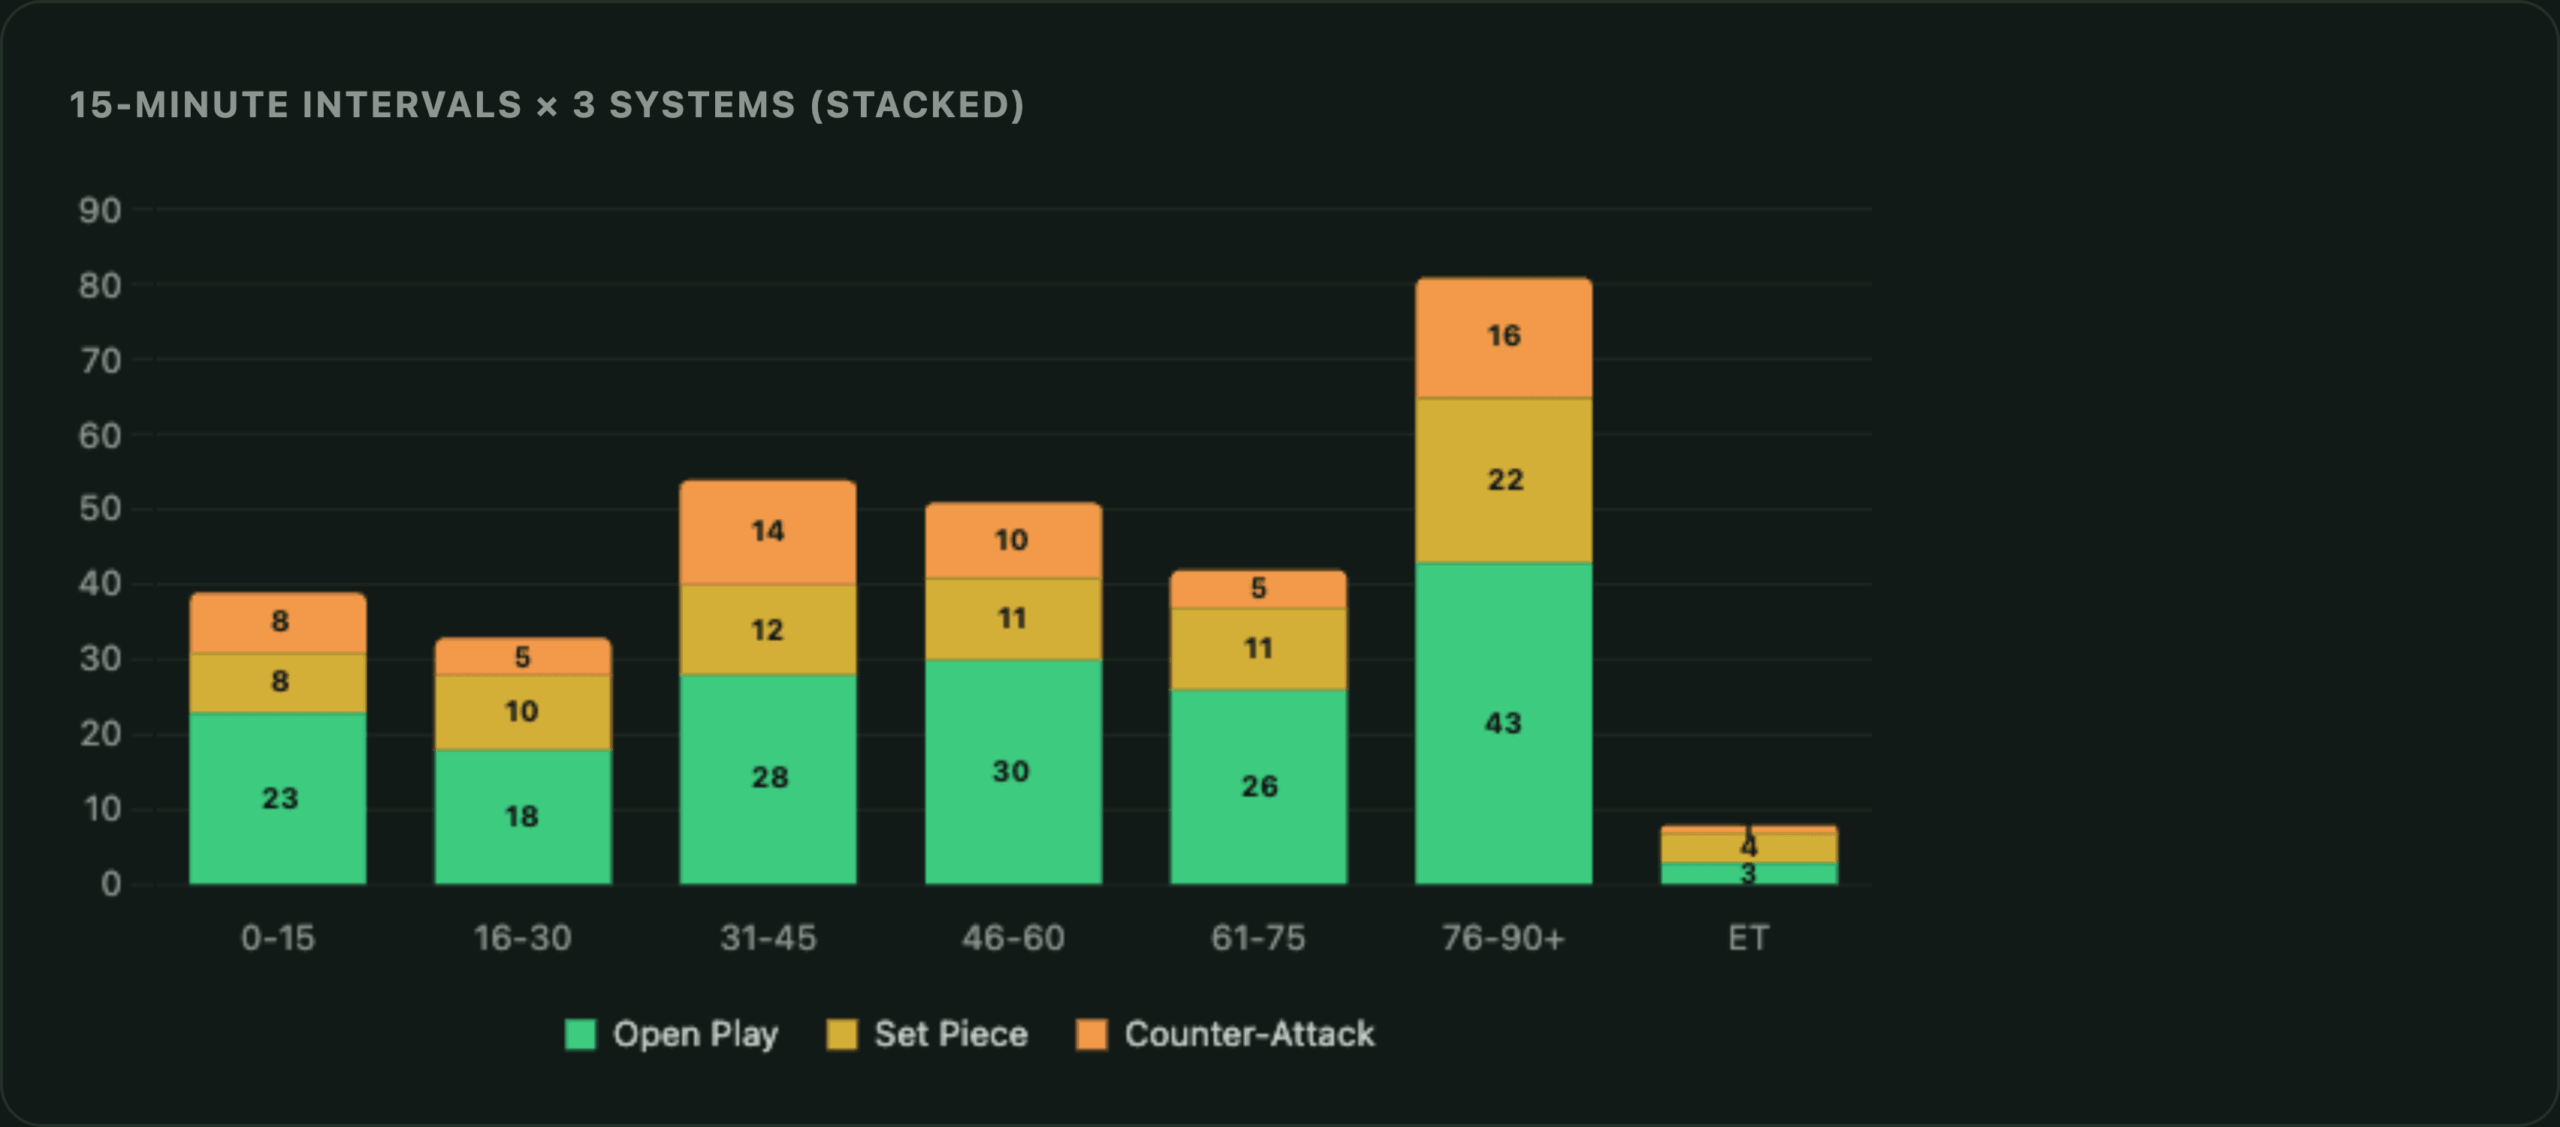
Look at the breakdown, though, and it’s not that simple. Of those 81 late goals, the split is Possession 53.1% / Set Piece 27.2% / Counter 19.8% — barely distinguishable from the overall average (55.5% / 25.3% / 19.2%). In other words, there’s no sign of a specific pattern spiking late on — no sudden surge of set pieces being forced through, no obvious wave of tired legs being punished on the counter. The far more accurate reading is that the sheer volume of chances goes up late in matches, while the mix of how those goals are scored barely changes at all.
That said, the degree of late-game concentration does climb as the rounds progress. In the Group Stage, 25.6% of all goals came after the 76th minute; by the Round of 16 that figure is up to 43.5%, and 40.0% in the semi-finals. It’s intuitive enough that tighter, more evenly matched knockout football tends to be settled late — though those later rounds carry small sample sizes (five goals in the semi-finals, one in the final), so this should be read as indicative rather than conclusive.
Summary: late goals really are more common — but not because anything unusual happens specifically late on. It’s simply the window where the largest number of scoring chances has had time to accumulate.
Topic 3: How Goals Change as the Rounds Progress
Compare raw goal counts alone and the tournament’s structure makes them fall steadily, from 215 in the Group Stage down to a single goal in the final. But that’s partly just a function of fewer matches being played. So instead, divide by the actual number of matches played at each stage (72 in the Group Stage, 16 in the Round of 32, 8 in the Round of 16, 4 in the quarter-finals, 2 in the semi-finals) to get a goals-per-match figure that can be compared fairly across rounds. The third-place play-off and the final are both single matches, meaning their “average” is really just that one result and doesn’t function as a sample — so both are excluded from this topic’s analysis.
The Big Picture First — Possession, Set Pieces and Counter-Attacks
Regroup the situations into the same three systems as before (Possession = Final Third Attacking + Progression + Build Up / Set Piece / Counter-Attack = High Press + Middle Press + Final Third Defending) and line them up by round, on a per-match basis.
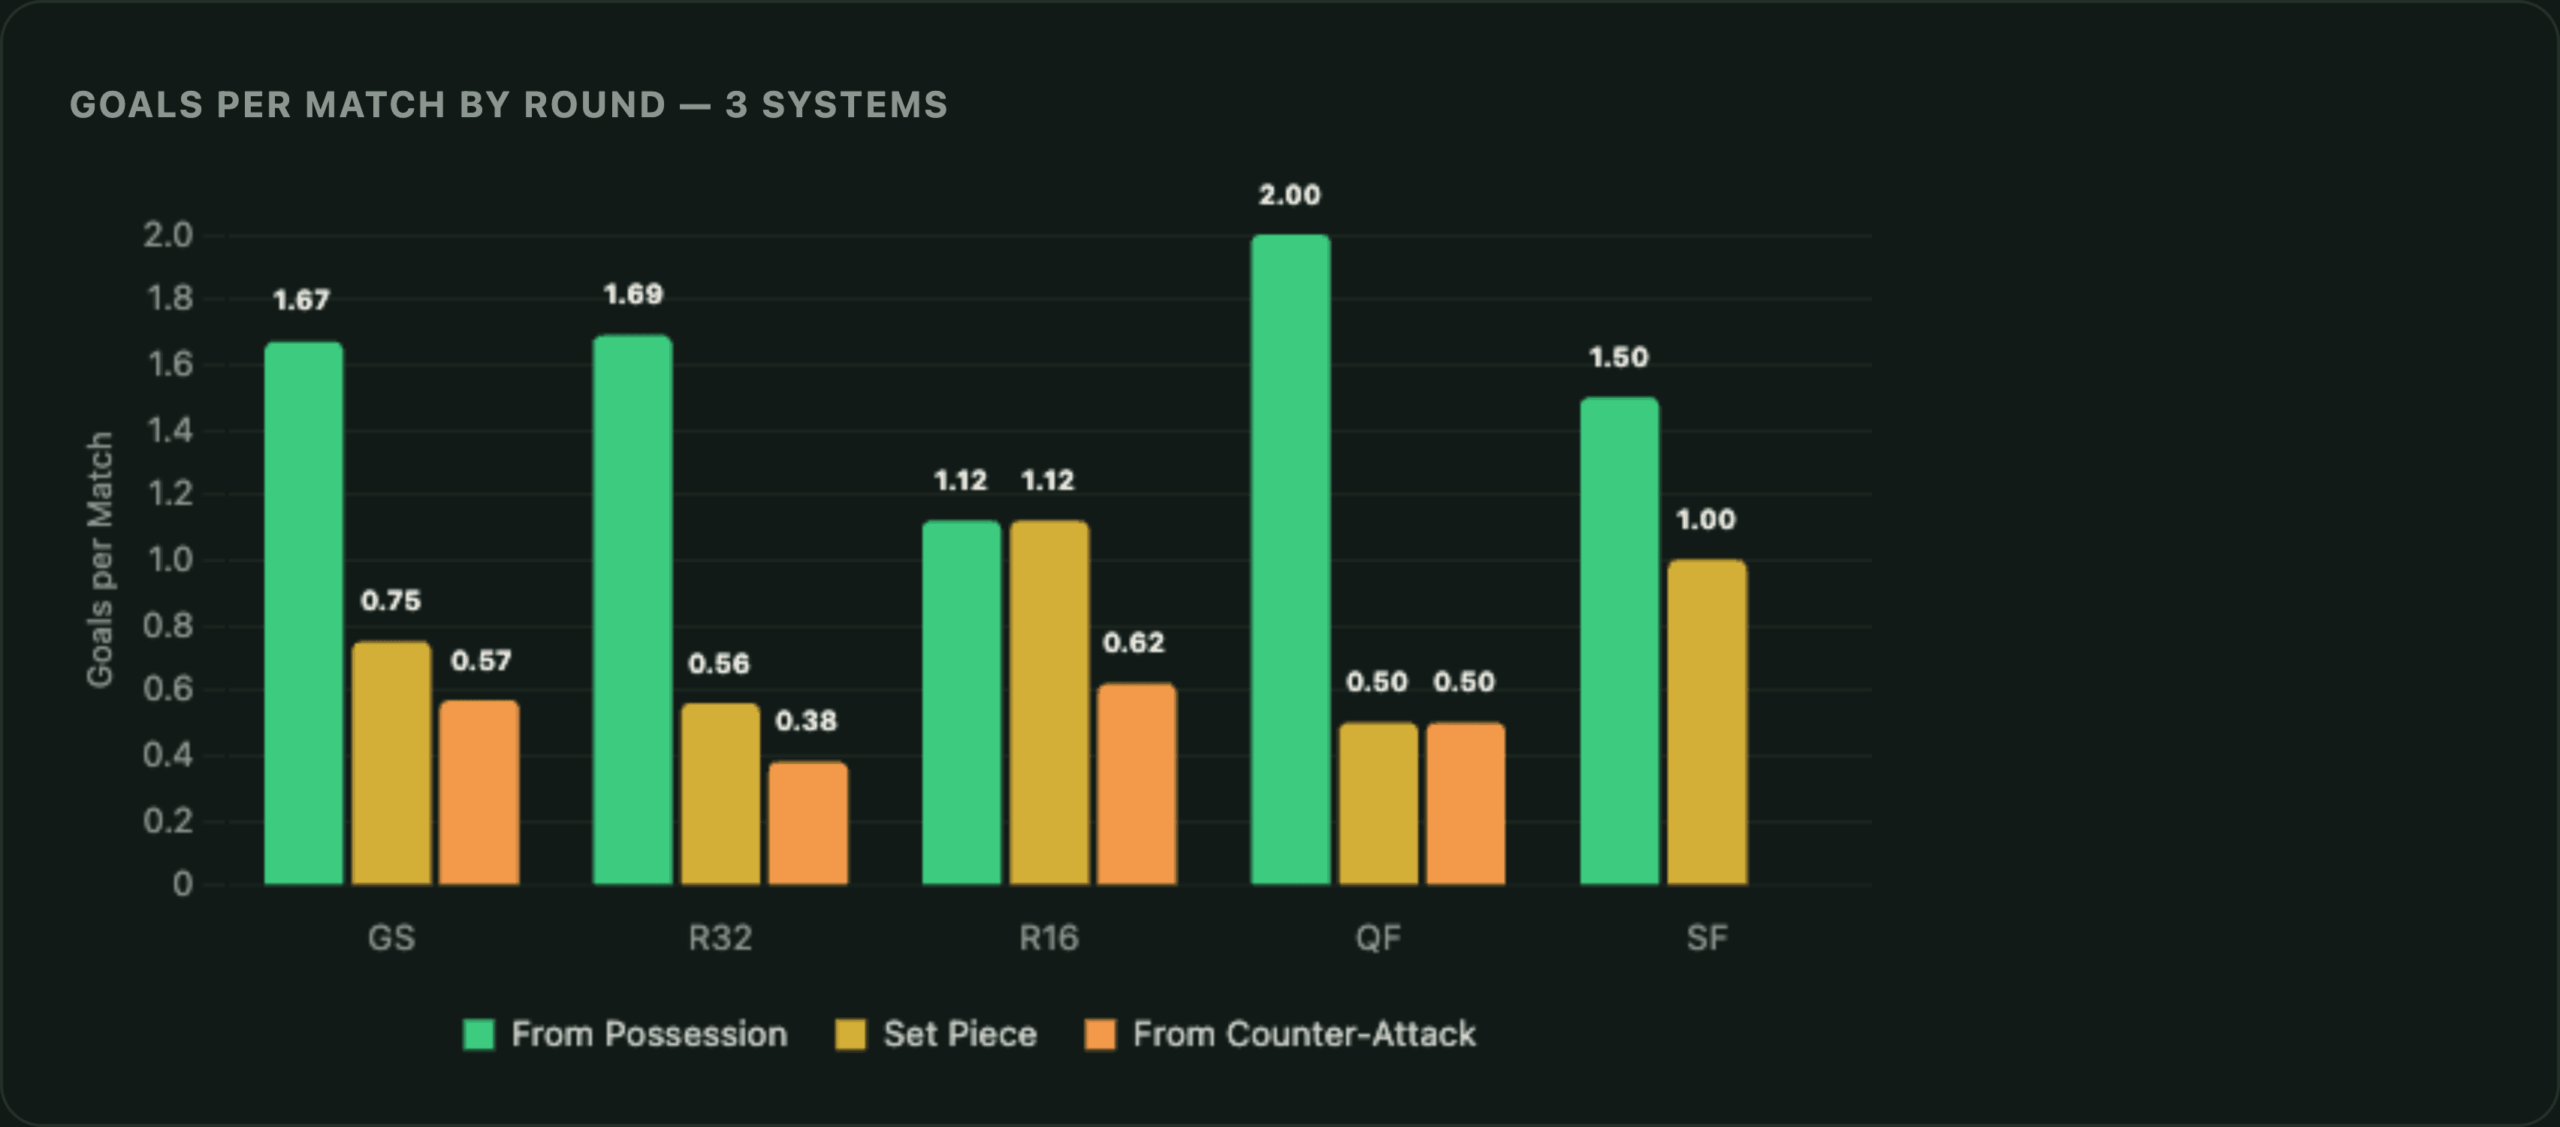
Possession-based goals hold up at a consistently high level throughout — 1.67 in the Group Stage, 1.69 in the Round of 32, 1.12 in the Round of 16, 2.00 in the quarter-finals, 1.50 in the semi-finals — but the Round of 16 is the one round where possession-based goals dip, and set pieces (1.12, the highest of any round) and counter-attacks (0.62) pick up the slack. That round alone was settled more by set pieces and the quality of individual moments than by sustained attacking play.
An unexpected finding: the Group Stage produced 2.99 goals per match on average. Add up the whole knockout stage (Round of 32 through to the semi-finals) and it comes to 2.73 goals per match — not that different at all. The idea that “knockout football gets harder to score in” doesn’t really hold once you look at actual goal density.
Looking at the Attacking Element Alone
Next, break the possession system down into its three parts: Final Third Attacking (breaking down the defence), Progression (advancing up the pitch) and Build Up (starting play from the back). Rather than goals per match, this looks at what share of that round’s possession-based goals each category accounts for — since the raw totals shrink round by round, working in percentages makes the rising-or-falling trend much easier to read.
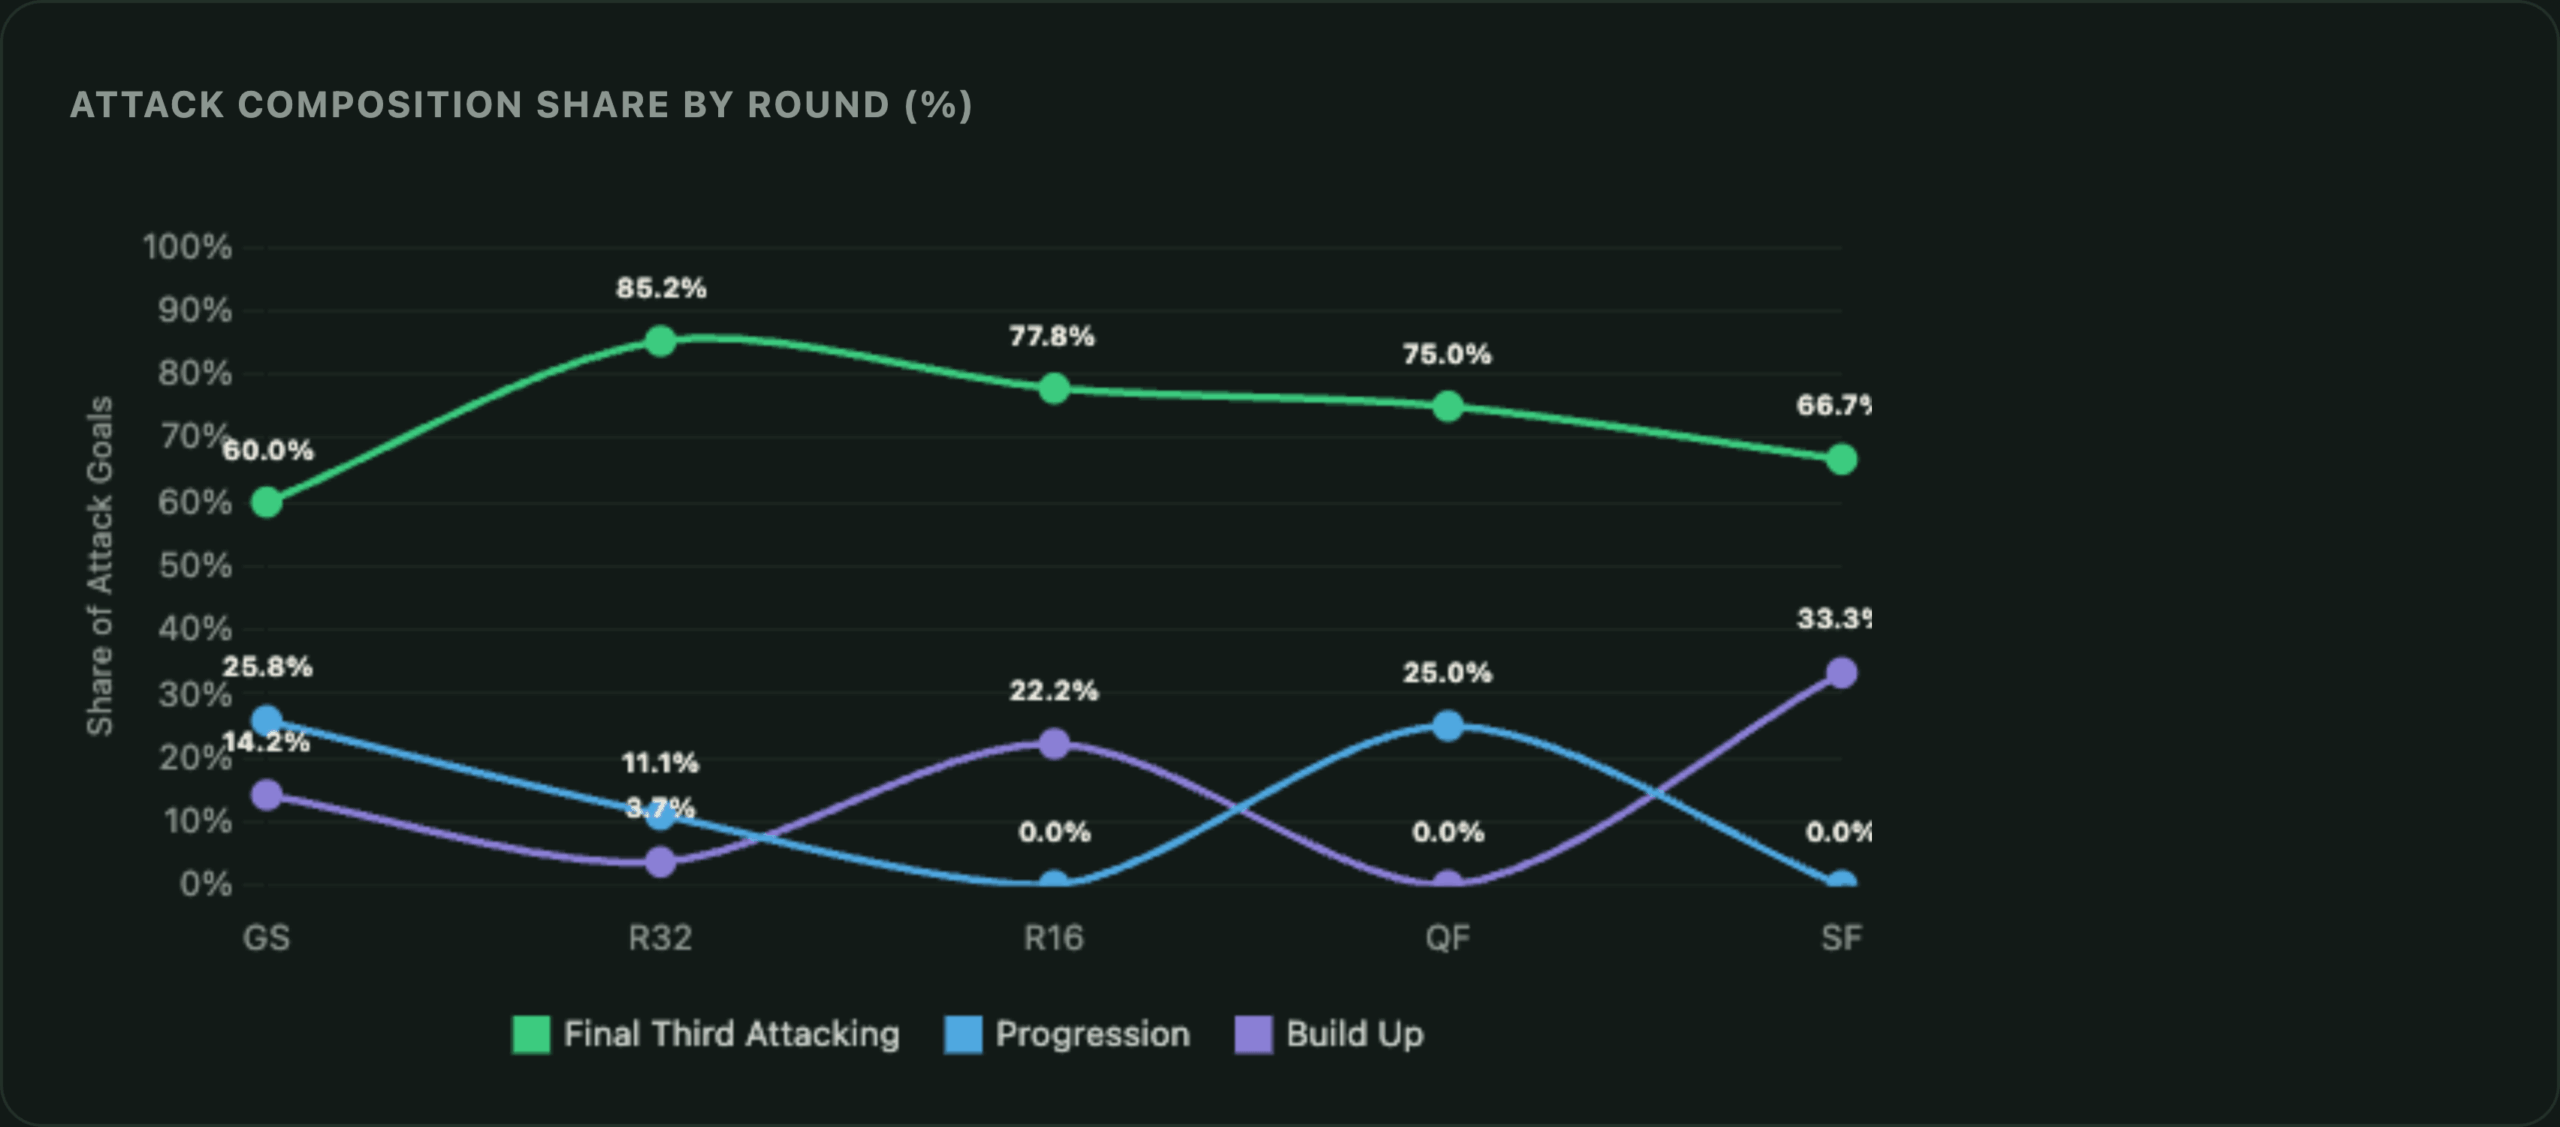
Progression’s share falls in a near-straight line, from 25.8% in the Group Stage to 11.1% in the Round of 32 to 0.0% in the Round of 16. It ticks back up to 25.0% in the quarter-finals, but that’s really just noise from a small sample (only 8 possession-based goals that round) — the underlying trend is that loose, advancing-play goals all but disappear once the knockout rounds begin. Build Up bounces around more erratically — 14.2% (Group Stage) → 3.7% (R32) → 22.2% (R16) → 0.0% (QF) → 33.3% (SF) — with small sample sizes making it hard to draw a clean line through it.
Final Third Attacking’s share, meanwhile, climbs sharply — from 60.0% in the Group Stage to 85.2% in the Round of 32 — and stays above 60% for the rest of the knockout stage (77.8% in the Round of 16, 75.0% in the quarter-finals, 66.7% in the semi-finals). The share of possession-based goals coming from breaking a defence down rises clearly and consistently as the rounds progress — it’s the cleanest trend in this section.
Looking at the Defensive Element Alone
Now break the counter-attack system down into High Press, Middle Press and Final Third Defending — again looking at each category’s share of that round’s counter-attack goals.
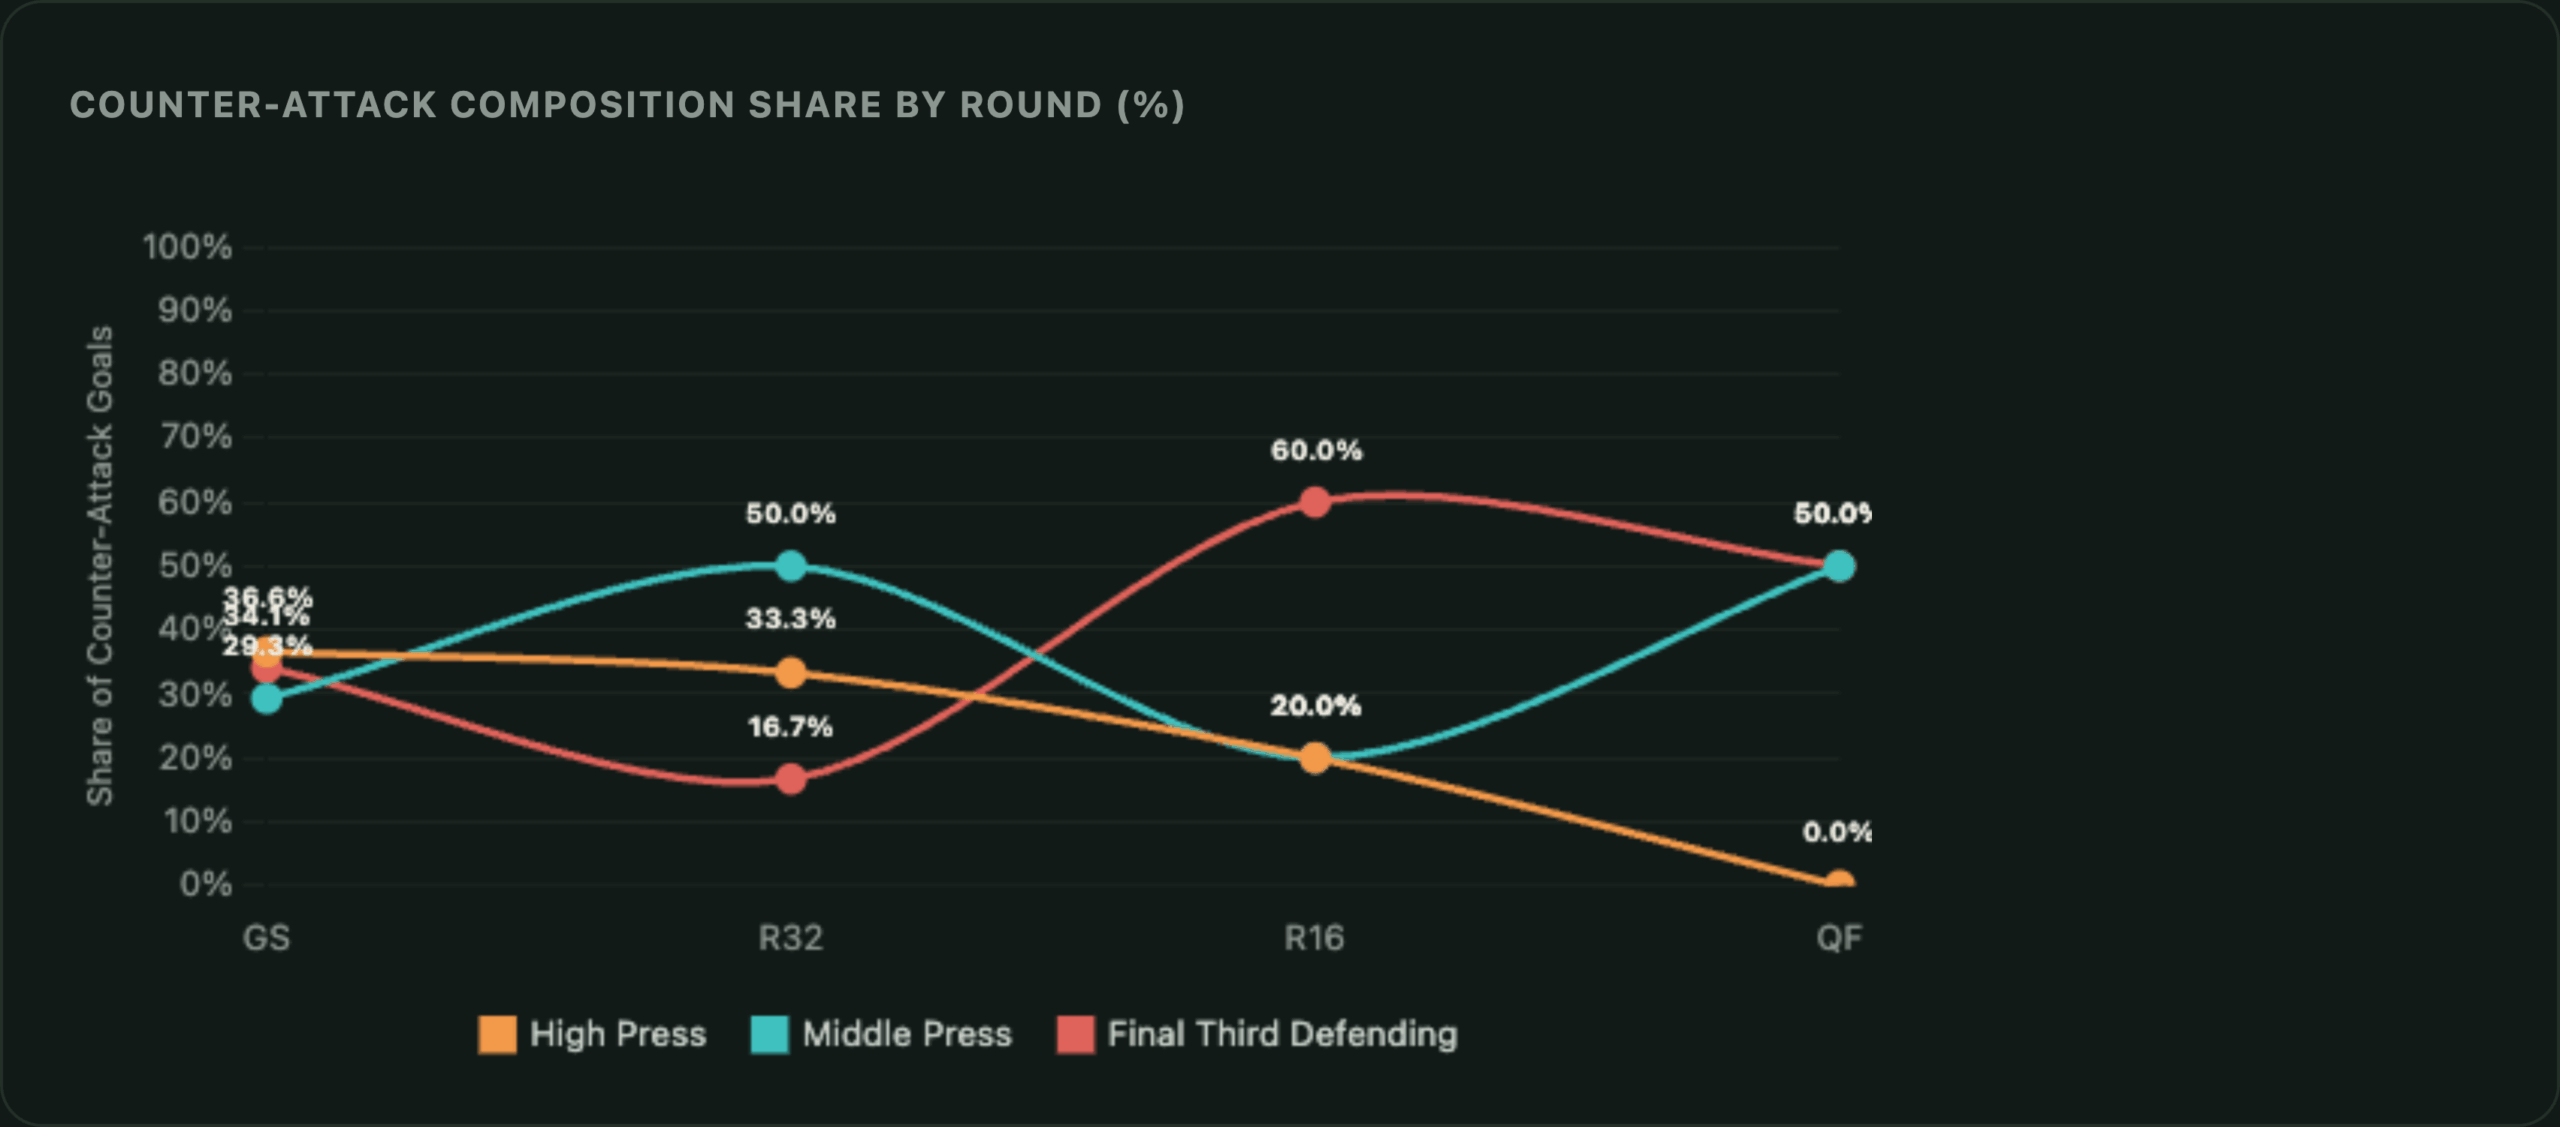
Note: the semi-finals produced zero counter-attack goals, so a composition share can’t be calculated for that round — it’s excluded from the chart above, which covers the Group Stage through to the quarter-finals only.
Final Third Defending’s share (counter-attacks off a settled low block that hasn’t been broken) drops from 34.1% in the Group Stage to 16.7% in the Round of 32, before jumping sharply to 60.0% in the Round of 16 and holding at 50.0% in the quarter-finals. High Press’s share (winning the ball back high up the pitch), by contrast, falls steadily and consistently — 36.6% (GS) → 33.3% (R32) → 20.0% (R16) → 0.0% (QF). Middle Press swings between 29.3% (GS) and 50.0% (R32 and QF) with no clear direction either way.
Those two lines effectively crossing over is the story of this tournament’s counter-attacking football. High-pressing counters were the dominant style in the Group Stage; by the time the knockout rounds arrive, low-block counters have overtaken them as the more common route to goal. A high press is physically exhausting, and in a one-off, lose-and-go-home match it becomes a harder style to commit to — a settled block that absorbs pressure and breaks quickly instead becomes the more common approach.
Put it all together and the Round of 16 stands out as the round with the least possession-based character (Progression effectively disappears, and Final Third Attacking’s raw level drops too), while set pieces and counter-attacks — Final Third Defending in particular — reach their peak presence. It’s a genuinely different “shape” of round compared with the rest of the tournament. As the second knockout round, played by squads that haven’t quite hit peak sharpness in a one-off match, it may be that games were more often decided by set pieces and defensive solidity than by sustained, well-structured attacking play.
Group Stage vs Knockout: The Numbers
Splitting the Group Stage from the knockout rounds (R32–SF) makes the finding from Topic 1 — that overall goal density barely changes at the broad level — easy to verify directly against this round-by-round breakdown.
Group Stage

Knockout Stage (Round of 32 – Semi Final)
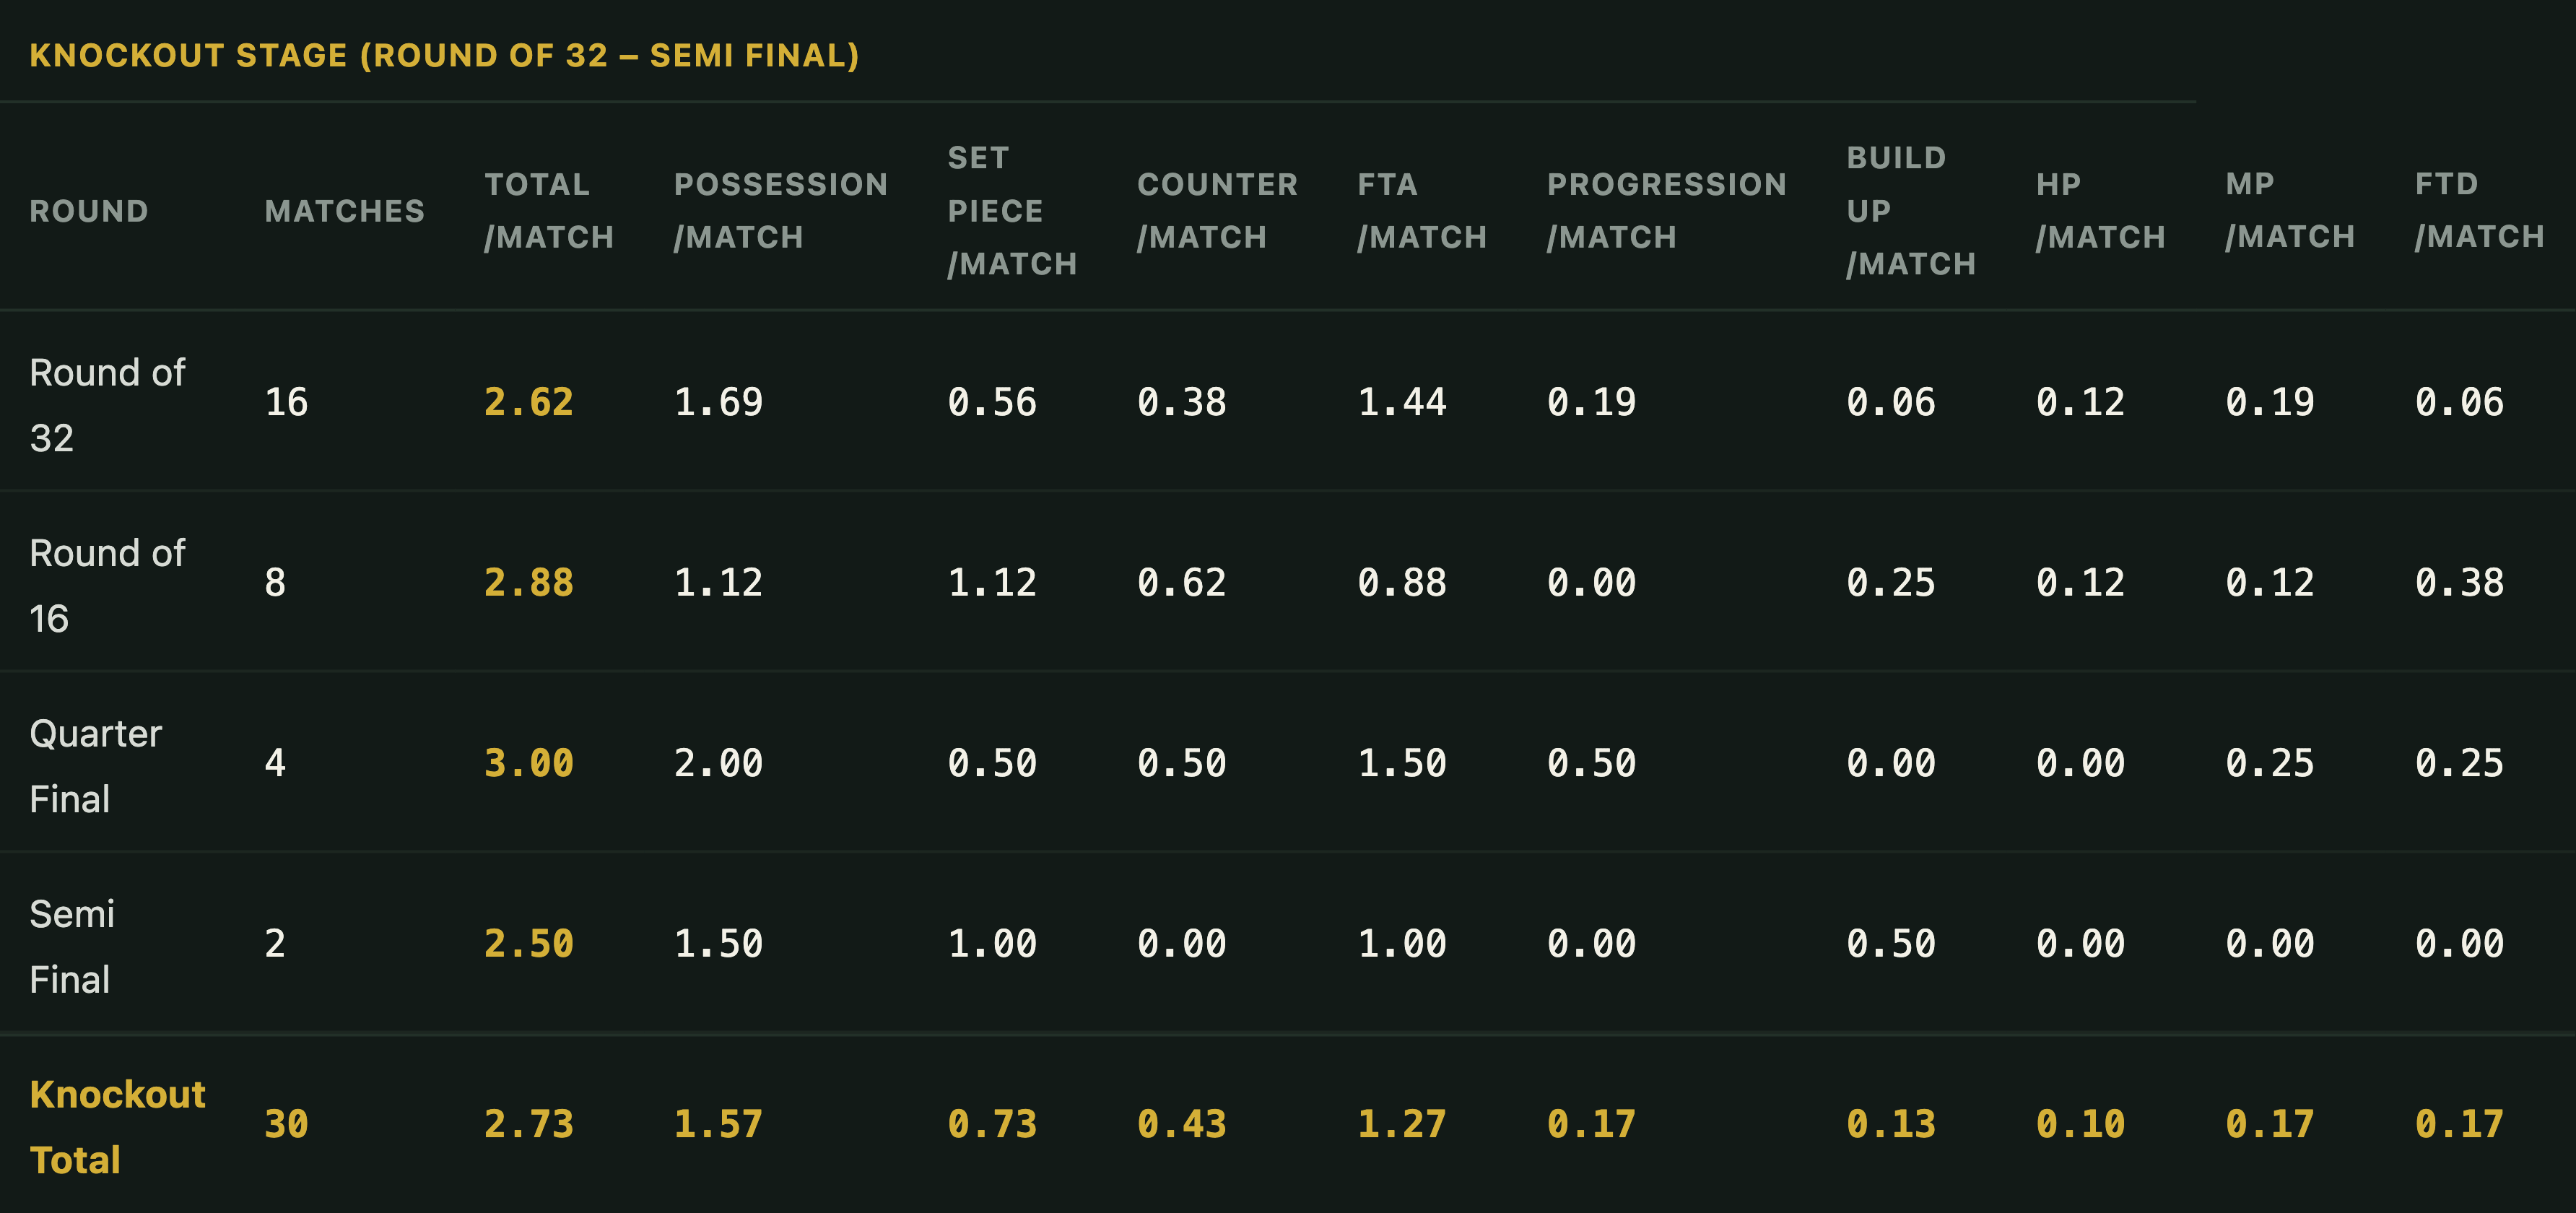
M = Matches. Poss. = From Possession. SP = Set Piece. Counter = From Counter-Attack. FTA = Final Third Attacking. Prog. = Progression. HP = High Press. MP = Middle Press. FTD = Final Third Defending.
*The third-place play-off (England 6-4 France) and the final (a single goal) are each drawn from just one match, meaning the “average” is really just that match’s result — so both are excluded from these two tables and from this topic’s figures and charts.
Topic 4: The Goal-Scoring DNA of the Leading Nations — Specialists, Possession Sides and All-Rounders
Look at the situation composition for any country with eight or more goals and the types quickly become obvious. “Leading nation” covers a lot of very different blueprints for how those goals actually got scored.
Four Profiles
Set-piece specialists — Argentina 42.1% · Egypt 50.0% · United States 45.5%. Nearly half their goals come from a single category — a highly repeatable pattern, but one that carries real risk if the opposition breaks them down instead.
Possession-based sides — Germany 63.6% · Canada 66.7% · Spain 57.1% · Belgium 57.1% · Senegal 50.0%. Heavily reliant on Final Third Attacking — their whole game hinges on the ability to break a defence down from possession.
Counter-attack specialists — Japan 37.5% · Brazil 40.0% · France 35.0% · England 30.0% · Mexico 30.0% · Morocco 30.0%. Their defensive shape doubles as their main attacking weapon, finished off with pace after winning the ball back.
All-rounders — England. The only country to place in the top five for goals-per-match in four of the seven categories — a repeatable threat that isn’t tied to any single pattern.
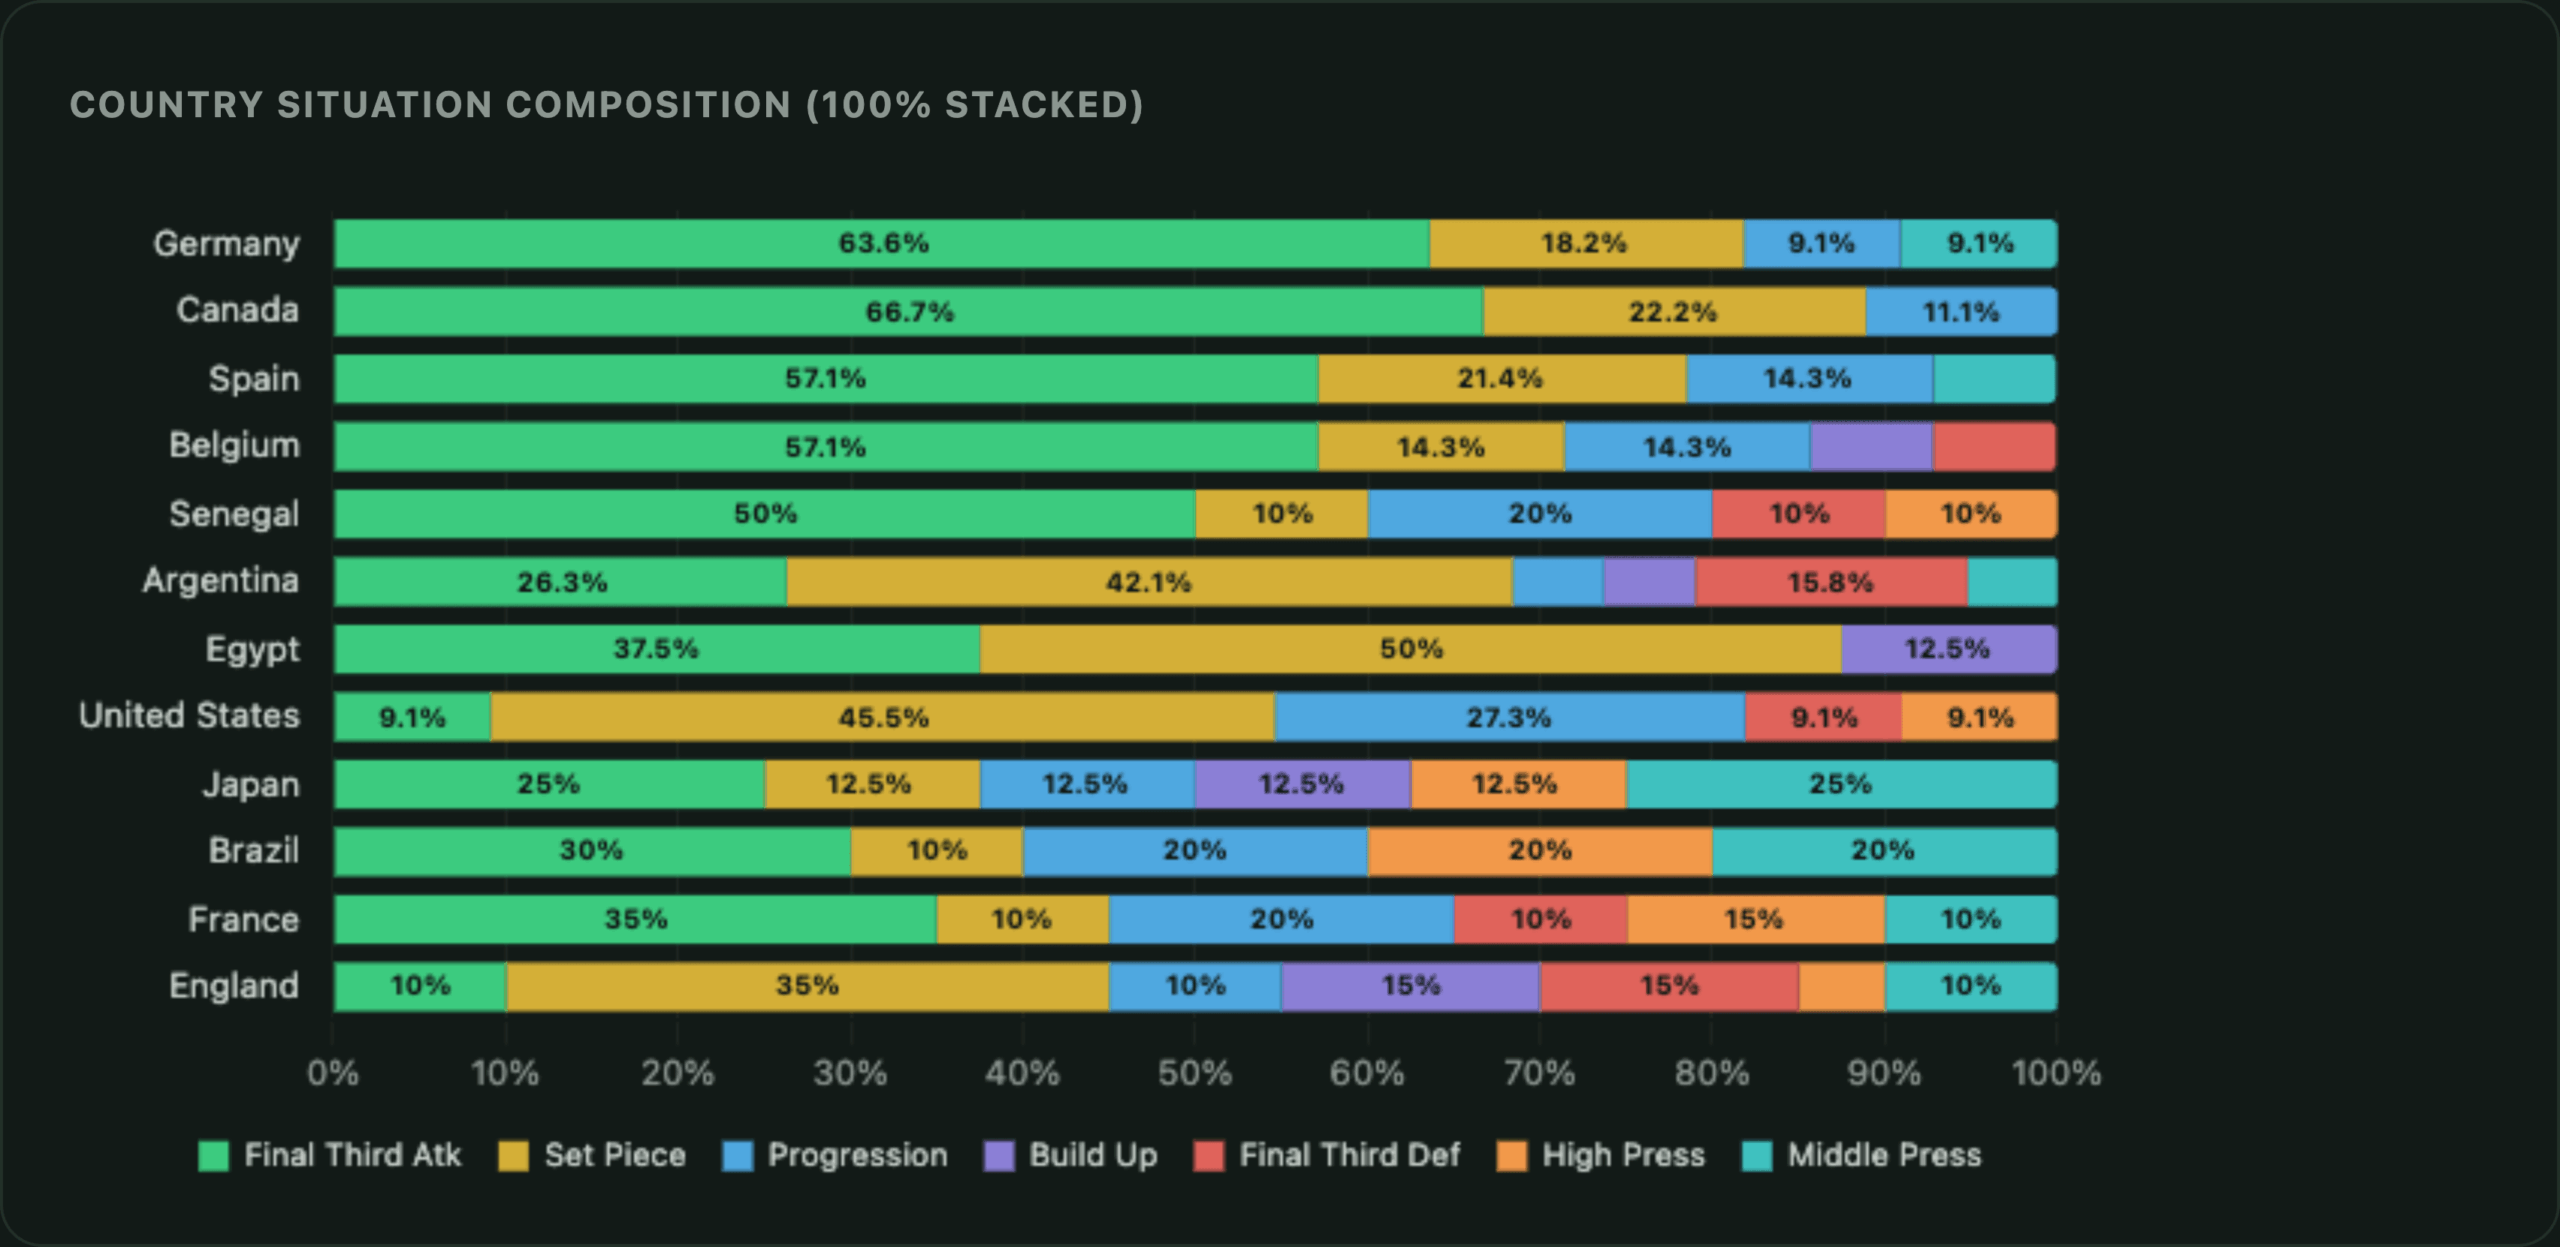
Argentina’s split between scoring and conceding is especially striking. 8 of their 19 goals (42.1%) came from set pieces, while of the 8 goals they conceded, 5 (62.5%) came via Final Third Attacking — in other words, they were broken down in open play. Only 2 of their conceded goals came from set pieces. “Score from set pieces, defend set pieces reasonably well, but vulnerable once the opposition breaks them down in open play” is a consistent profile that shows up clearly in the numbers on both sides of the ball.
The goals-per-match figures reinforce this picture further. Argentina’s set-piece scoring rate works out to 1.00 goal per match, tied for the best in the tournament — confirming “the set-piece nation” both by share (quality) and by rate (volume). Colombia, on the other hand, shows the risk of reading too much into share alone: their Middle Press composition looks striking at 40% (2 of their 5 total goals), but with such a small base, that only works out to 0.40 goals per match once matches played are factored in.
Topic 5: Dissecting the Set-Piece Numbers
Break all 78 set-piece goals down by type and corners come out on top with 39 goals (50.0%), followed by free kicks at 17 (21.8%), penalties at 16 (20.5%), and long throws at 3 (3.8%). A further 3 goals (3.8%) came from countering after defending an opponent’s set piece (a corner or long throw). Corners were clearly this tournament’s main set-piece battleground.
“Attacking” vs “Defending” — an important distinction: in the data, “Corner Kick” and “Long Throw” mean goals scored directly from a team’s own set piece (Attacking). “Defending Corner Kick” and “Defending Long Throw”, on the other hand, mean a goal scored by defending against the opposition’s corner or long throw and immediately breaking on the counter. Both involve a corner or throw-in, but the origin is the exact opposite in each case — your own attack versus repelling the opposition’s — so the chart below treats them as separate categories.
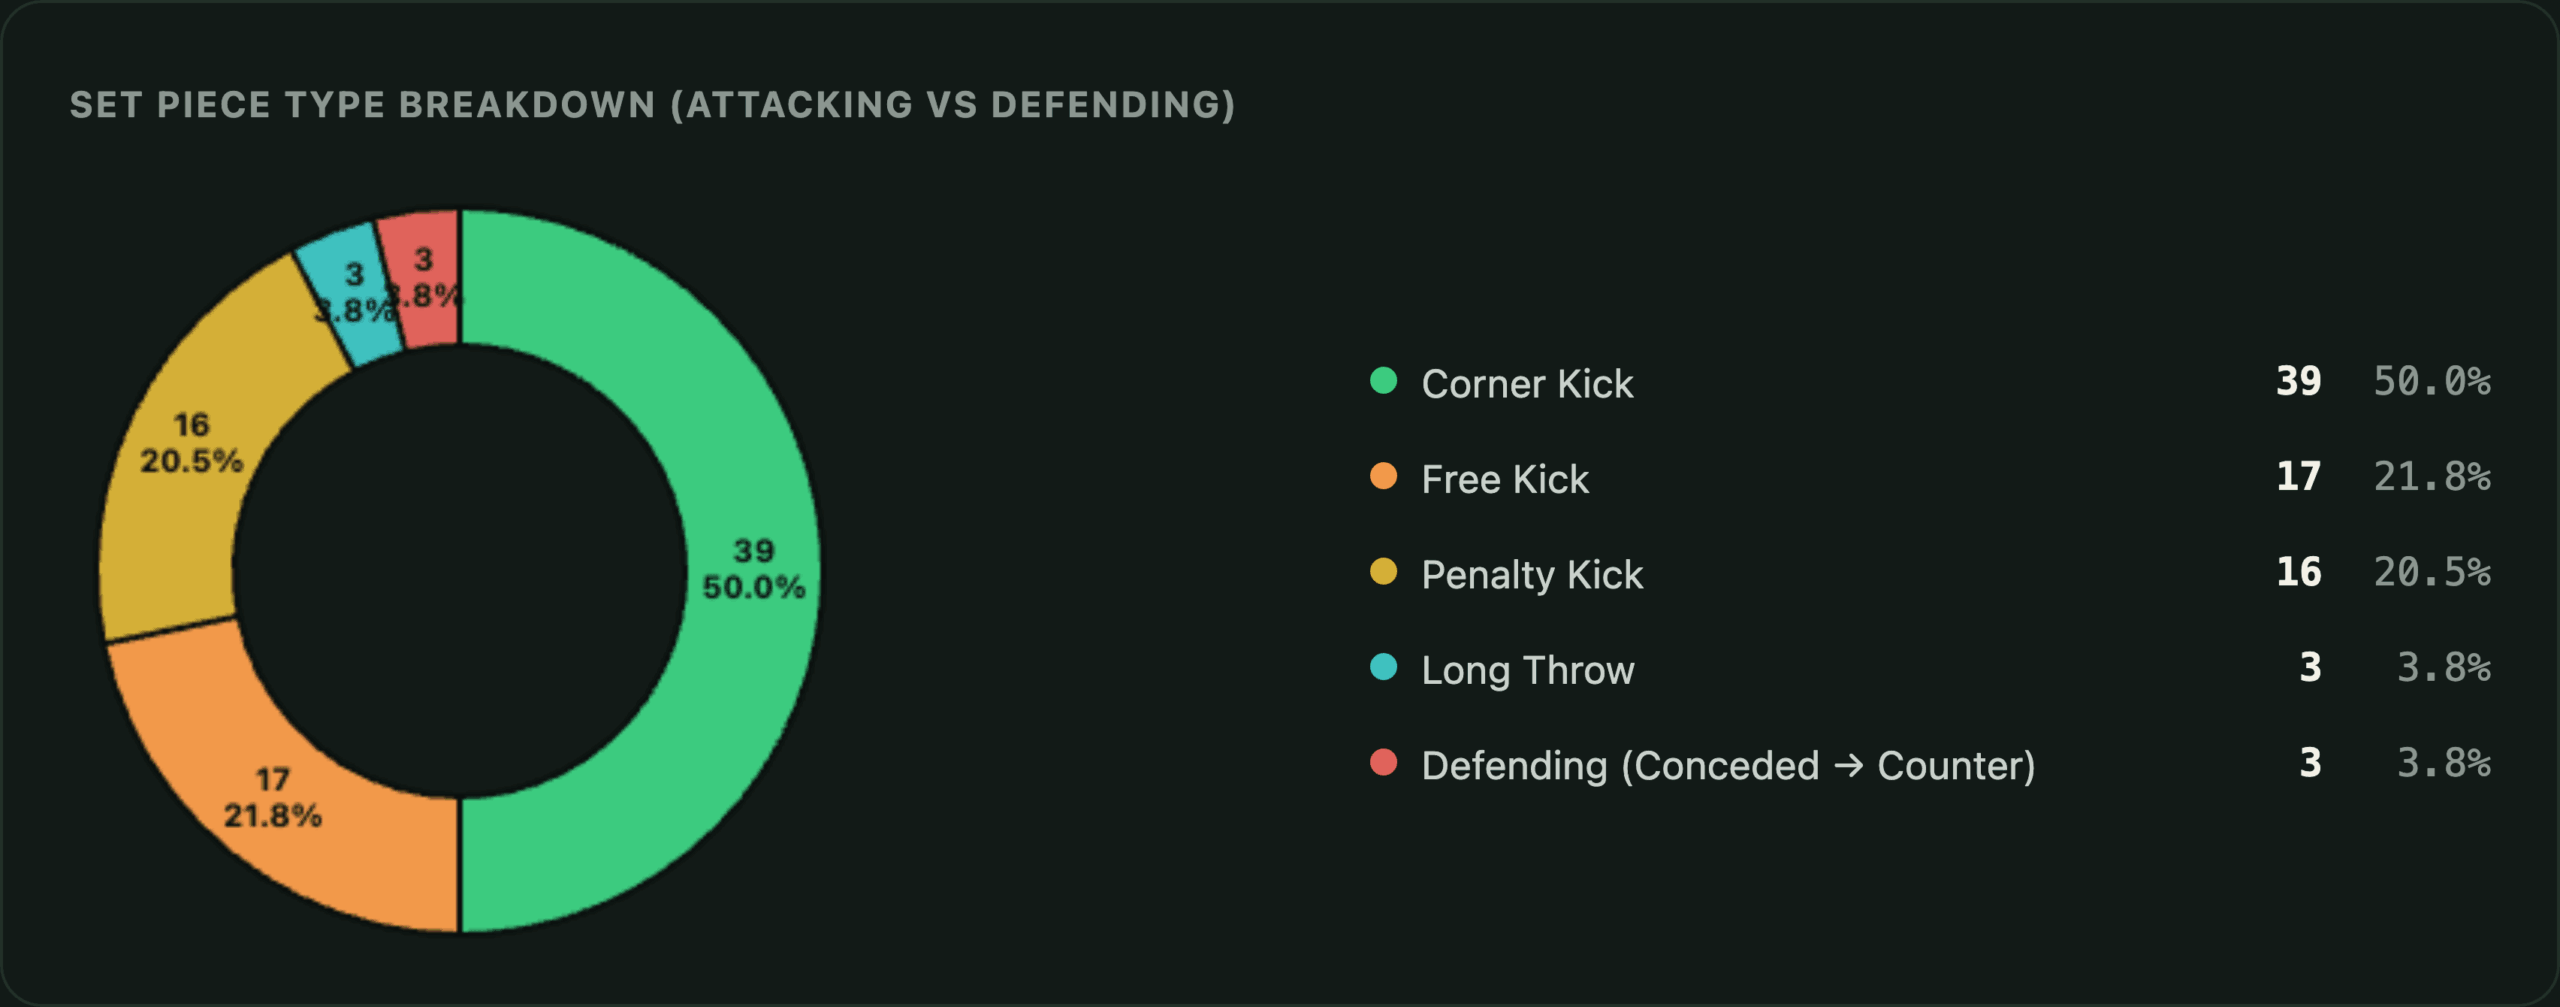
Break it down further by phase and an interesting structure emerges. Of the 78 set-piece goals, 67 (85.9%) were scored directly from the first phase of the delivery, 8 (10.3%) came from a second-phase attack after the ball broke loose (the same team having another go), and 3 (3.8%) came from the “Defending” category — scored on the counter after seeing off the opposition’s set piece. In other words, the vast majority of this tournament’s set-piece goals were well-drilled first-phase patterns executed as planned; goals from scrambles or defensive situations were the minority.
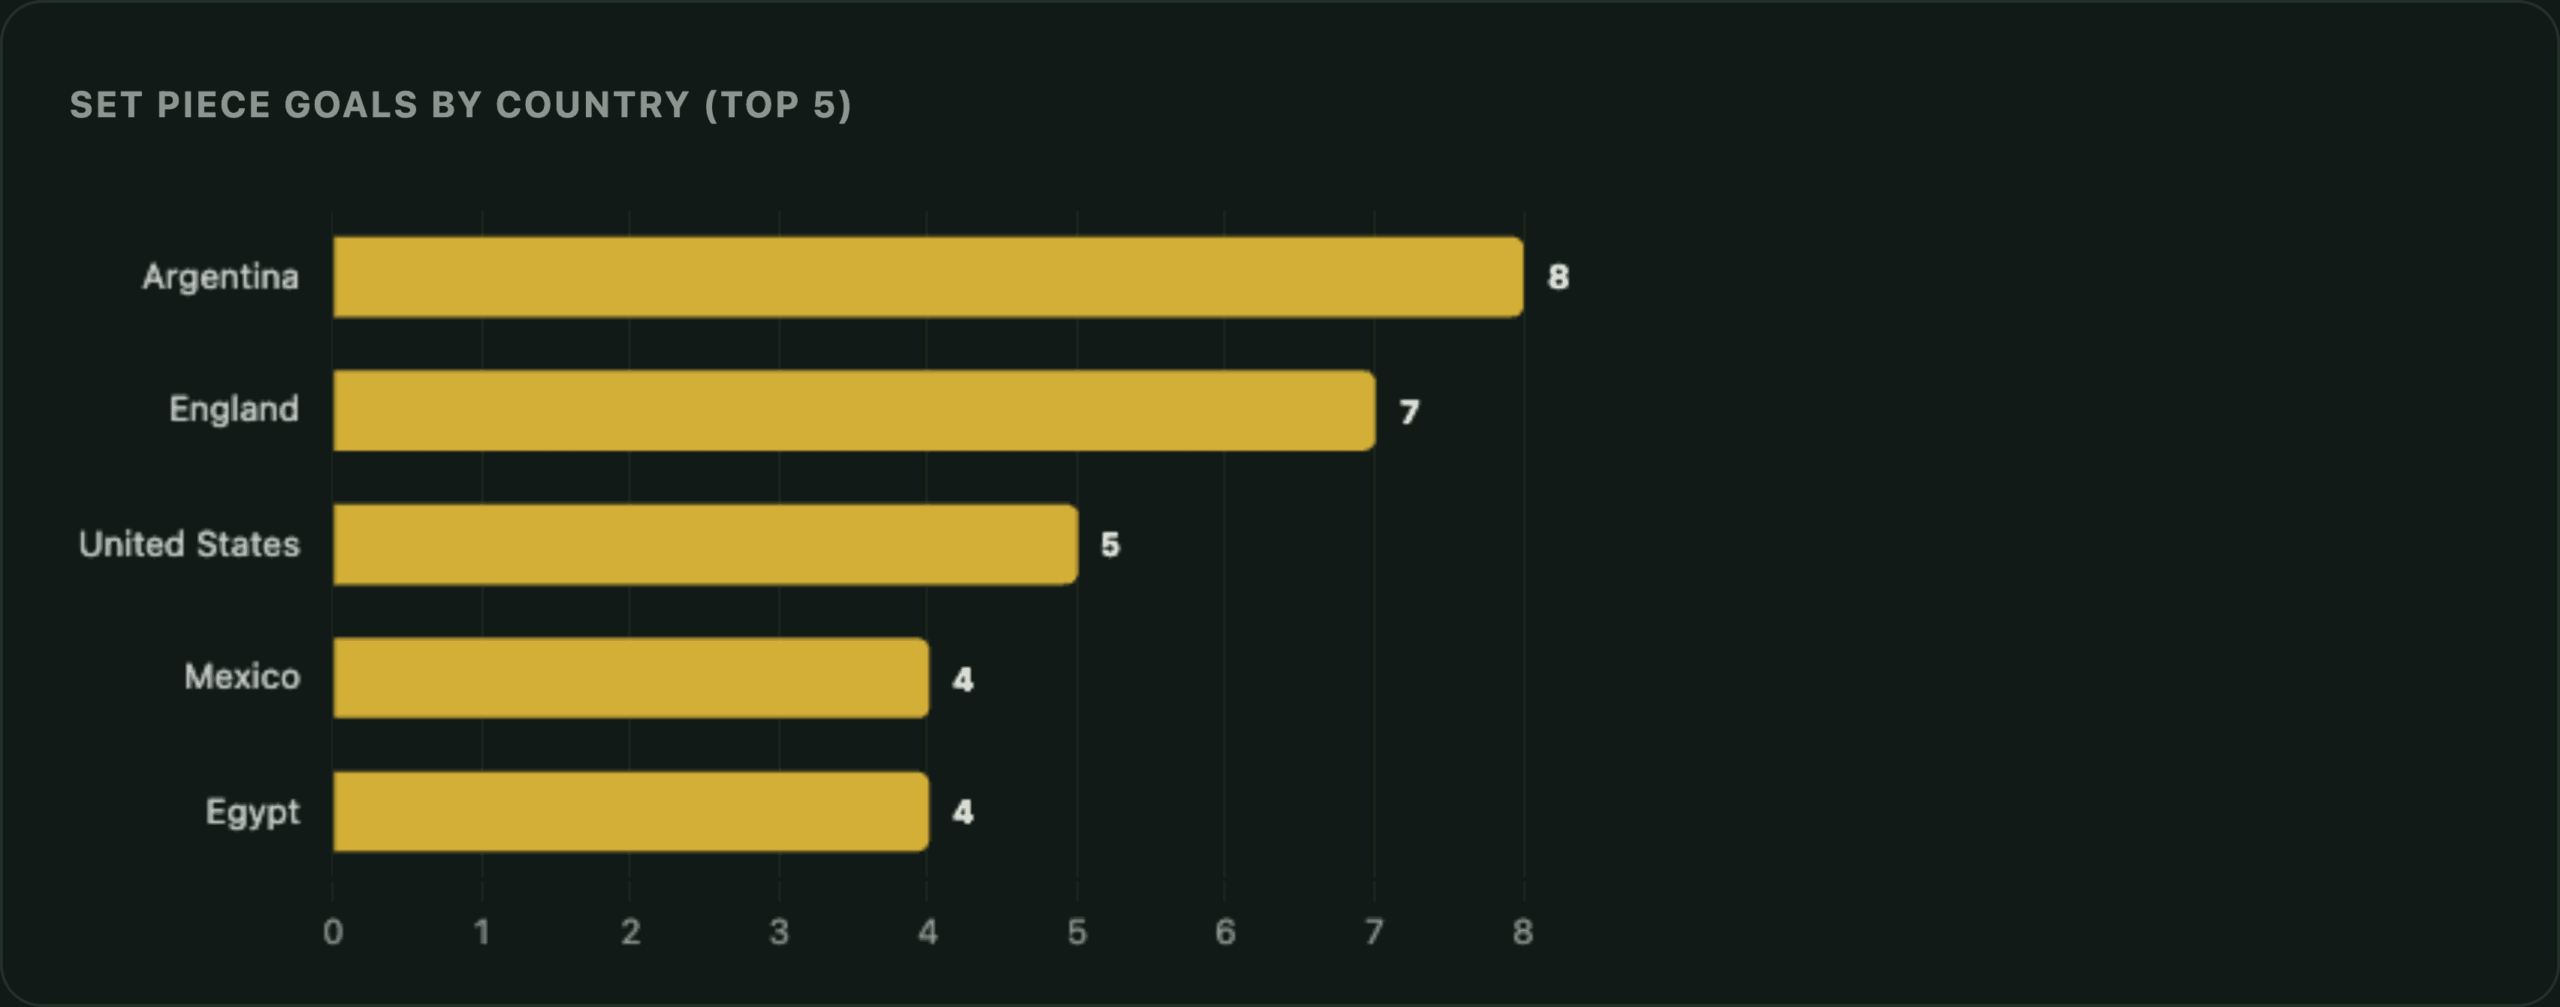
By country, Argentina lead the way with 8 set-piece goals, followed by England on 7, the United States on 5, and Mexico and Egypt on 4 each. But even among these set-piece powerhouses, the make-up looks completely different.
Argentina: 4 corners + 1 second-phase corner + 2 direct free kicks + 1 penalty — heavily corner-weighted.
England: 3 penalties + 3 corners + 1 second-phase corner — penalties and corners roughly balanced.
United States: 2 direct free kicks + 1 free kick + 1 corner + 1 long throw — a distinctly free-kick-heavy profile.
Summary: “strong at set pieces” isn’t one single thing. Argentina’s is a “corner blueprint”, the United States’ is built on the quality of their free-kick delivery — every nation carries a different weapon. Any analysis of set-piece strength needs to split opponents out by corners, penalties and free kicks rather than treating “set pieces” as one bucket.