Never Throw the Ball Forward When Throw-in! [Academic Football Analysis]
Introduction
The number of research about throw-in in football is much less than the number of research about other set pieces such as corner kicks or free kicks. Especially, research about performance analysis of throw-in is less popular than biomechanical analysis about throw-in in terms of how to throw the ball further. However, I think that it is less effective to research about how to throw the ball further without knowing how it influences the game. Therefore, the purpose of this article is to summerise some pieces of research of performance analysis about throw-in and combine the analysis from the view of both quantitative analysis and tactical analysis.
Academic Research about Throw-in
Interestingly, there is a correlation between the success rate of throw-in and the position in the league table.
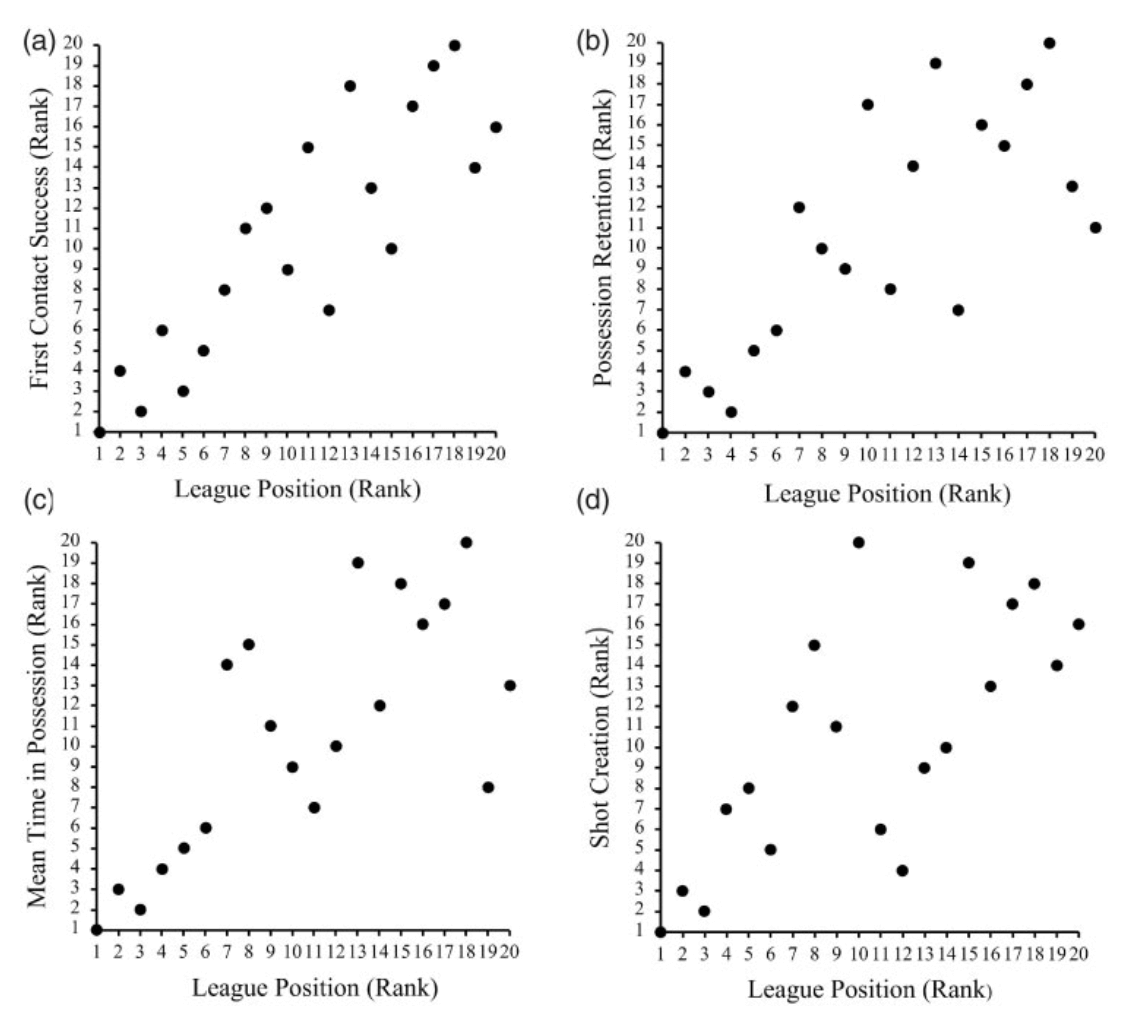
According to Stone et al. (2021), in the research of English Premier League in 2018-19 season, there were correlations between the position in the league table and some factors such as ‘first contact success’, ’possession retention’, ’mean time in possession’ and ’shot creation’. It is obvious that the existence of correlations does not mean there is causal relationships. However, as there were correlations between the position in the league table and some indicators which determine the performance of throw-in, it is worth researching about throw-in and finding out whether they are causal relationships or not. Therefore, in this chapter, some pieces of research are going to be summerised to understand throw-in in football more.
First of all, do you know how many times a team throw the ball in in a single game? According to Wiebe (2013), the average number of throw-in for a team in a single game in 2012-13 season of some European leagues is 22.49 in English Premier League, 21.42 in Serie A, 23.78 in Bundesliga and 26.04 in Ligue 1. These numbers indicate that throw-in happens more frequently than any other set pieces such as corner kicks, goal kicks or free kicks (Stone et al., 2021). Then, does this mean throw-in should be more paid attention than other set pieces? This will be a question which is aimed to be solved in this article.
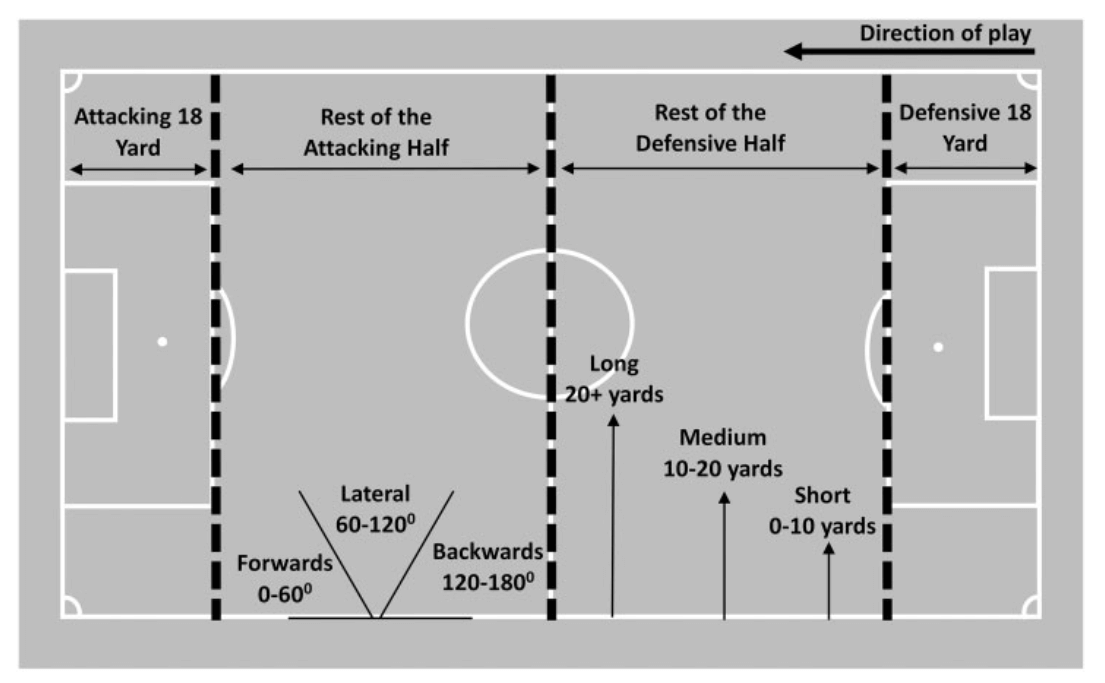
In some pieces of research about performance analysis of throw-in, how the factors such as the distance, direction, area, opposition pressure or time after the ball goes out influence the results such as first contact success, possession retention, mean time possession or shot creation is usually considered (Augste and Prestel, 2021, McKinley, 2018 and Stone et al., 2021). However, the first thing which should be discussed is the purpose of throw-in because this determines what should be researched.
The main reason why the analysis of corner kicks or free kicks are more popular is these set pieces can produce many goal scoring opportunities. It is obvious that the number of goals is the most important in football. Therefore, set pieces such as corner kicks or free kicks which produce many goal scoring opportunities can get more attention. Then, how about throw-in? When analysing throw-in, only long throw-in in the final third which can produce goal scoring opportunities is often considered. In the previous chapter, it was mentioned that how to throw the ball further is famous to be researched. This is based on the idea of creating chances by throwing the ball further.
However, how many chances to play long throw-in are there in a single game? According to the study of Stone et al. (2021), the percentage of the number of throw-in from the area within the attacking 18 yard is just 15% of the whole number of throw-in in a single game. If there are 25 throw-in in a game, the number of throw-in in the attacking 18 yard is just from three to four.
Moreover, Augste and Prestel (2021) proposed that the percentage of the number of throw-in in the final third is about 16% and it means there are only about four throw-in in a game. Obviously, the sample size is different and the number of research is less so further research is required. However, it is fair to say that the number of chances to play long throw-in is not many.
Then, what is the purpose of the rest of 85% throw-in? It would be securing the possession from throw-in for the attacking team and regaining the ball would be the objective for the defending team. And in order to secure the possession, it is important to win the first contact. Therefore, some factors which determine the success of the first contact and of course, the possession retention are going to be summerised.
1 Direction of Throw-in
Firstly, the direction of throw-in is going to be discussed. In many cases, the football is thrown forwards. In the study of Stone et al. (2021), the direction of throw-in was categorised into forwards, lateral and backwards and it was reported that 41.3% of throw-in was played forwards. However, it was less effective to throw the ball forwards than lateral or backwards in terms of securing the possession. The probability of winning the first contact was 89.2% when the ball was thrown lateral and 99.5% when the ball was thrown backwards, but it decreased to 67.6% when the ball was thrown forwards. Additionally, the probability of retaining the possession was 64.5% when the ball was thrown lateral and 83.5% when the ball was thrown backwards, but it dropped to 48.3% when the ball was thrown forwards.
It is interesting that the ball is the most frequently thrown towards the most ineffective direction. I strongly believe that this indicates that the strategy of throw-in can improve more and more.
2 Distance of Throw-in
Secondly, the distance of throw-in is going to be examined. In the study of McKinley (2018), the relationships between the distance of throw-in and the first contact and the possession retention were researched. As a result, it was reported that if the distance was less than 10 yards, the probability of first contact success was higher than 90%. However, the longer the distance became, the lower the probability would be. For example, if the distance was 20 yards, the probability was about 80% and if the distance was 30 yards, the probability was about 63%. However, more interestingly, McKinley (2018) stated that the distance of throw-in did not affect the probability of the possession retention. No matter how long the distance was, it was around 60%.
However, even though the distance of throw-in is same, the probability of the success of throw-in can be different if the direction of throw-in is different. Stone et al. (2021) proposed that the distance of throw-in did not affect the probability of the success of throw-in if the ball was thrown backwards, but it did if the ball was thrown forwards as the longer the distance, the lower the probability of the success.
3 Area of Throw-in
Thirdly, the influence of the area of throw-in is going to be discussed. Based on the method which divides the pitch into four areas, the throw-in in the defensive 18 yard was the worst probability of both the success of throw-in and the possession retention Stone et al. (2021). As McKinley (2018) suggested that the ball tends to be thrown forwards in the own half, it is difficult to throw the ball backwards due to the limit of the length of the pitch. Therefore, a player is forced to throw the ball forwards in the deeper area of the own half even though the probability of the success of the throw-in is low.
4 Time after the Ball Goes out
Finally, the time from the ball goes out to the ball thrown is going to be analysed. McKinley (2018) proposed that the most of throw-in was played in 7 to 15 seconds after the ball went out, but if the ball was thrown in five seconds, the probability of the success of throw-in was the highest. However, if the ball was thrown within five seconds, the probability was not as high as in five seconds. This is because teammates are not ready to receive the ball. On the other hand, if the ball was not thrown in five seconds, the probability was gradually decreasing This is because the opposition players can prepare for defending the throw-in.
So far, some pieces of research were summerised to understand throw-in more based on the data. As a result, it was found that the number of throw-in in the attacking third which can create goal scoring opportunities is from just three to four in a single game, so it is more important to think about the other 20 throw-in in a game. Additionally, it was also concluded that the key for successful throw-in is throwing the ball backwards in five seconds after the ball goes out of the touchline and from the defensive perspective, it is important to press high when the attacking team throws the ball from deep area of their own half as the success rate is extremely low.
In the next chapter, throw-in is going to be discussed from the view of tactics.
Practical Analysis with Academic Result
It is important to use the result of academic research to improve tactics on the pitch. Therefore, in this chapter, throw-in is going to be analysed from the practical perspective.
As those research suggest, throwing the ball before the opposition team setting up the defensive structure can guarantee the possession. With using the data, it can be described as ‘5 seconds rule in throw-in’. However, as it was mentioned before, the five seconds are just a rough slandered. From the attacking perspective, offering a safe passing lane and throwing the ball before the opposition organises themselves into the defensive shape are key factors to secure the possession. On the other hands, from the view of the defending team, it is important to shuffle across to the ball side and set up the defensive block to win the possession back.
In addition to the element of time, throwing the ball backwards can guarantee the possession with a high rate of success. Therefore, it wastes a valuable opportunity to regain the possession if the defending team thinks that it is okay to let the opposition throw the ball back. Instead of this extremely defensive idea, it is better to set up the pressing shape which cuts the option to throw the ball back and forces the opposition to throw the ball forwards, which success rate is low. However, the decision if going to press or sitting deeply depends on the game situation because pressing high contains a risk to be exploited the space in behind or the opposite side.
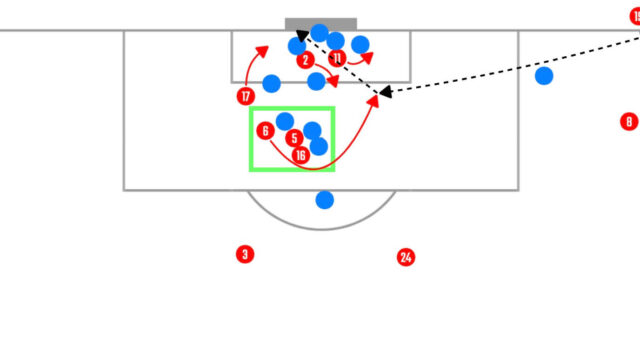
Furthermore, the distance of throw-in can also affect the probability of the success of throw-in. Obviously, longer throw-in is more difficult to win the first contact or secure the possession. Therefore, it is important to cut the option to throw the ball shorter, in other words to throw the ball to the opposition feet. This can change the way to mark the opposition player from just following the opposition from his or her back to standing in front of him or her to prevent the opposition thrower to throw the ball on the feet. For example, Liverpool is defending throw-in with a zonal system to stop the opposition to throw the ball shorter. Please find out the detail from the article below.
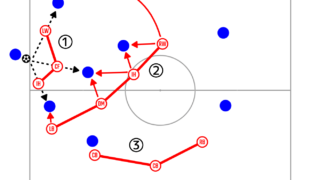
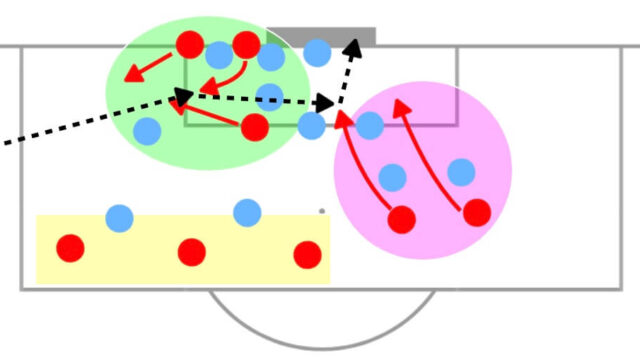
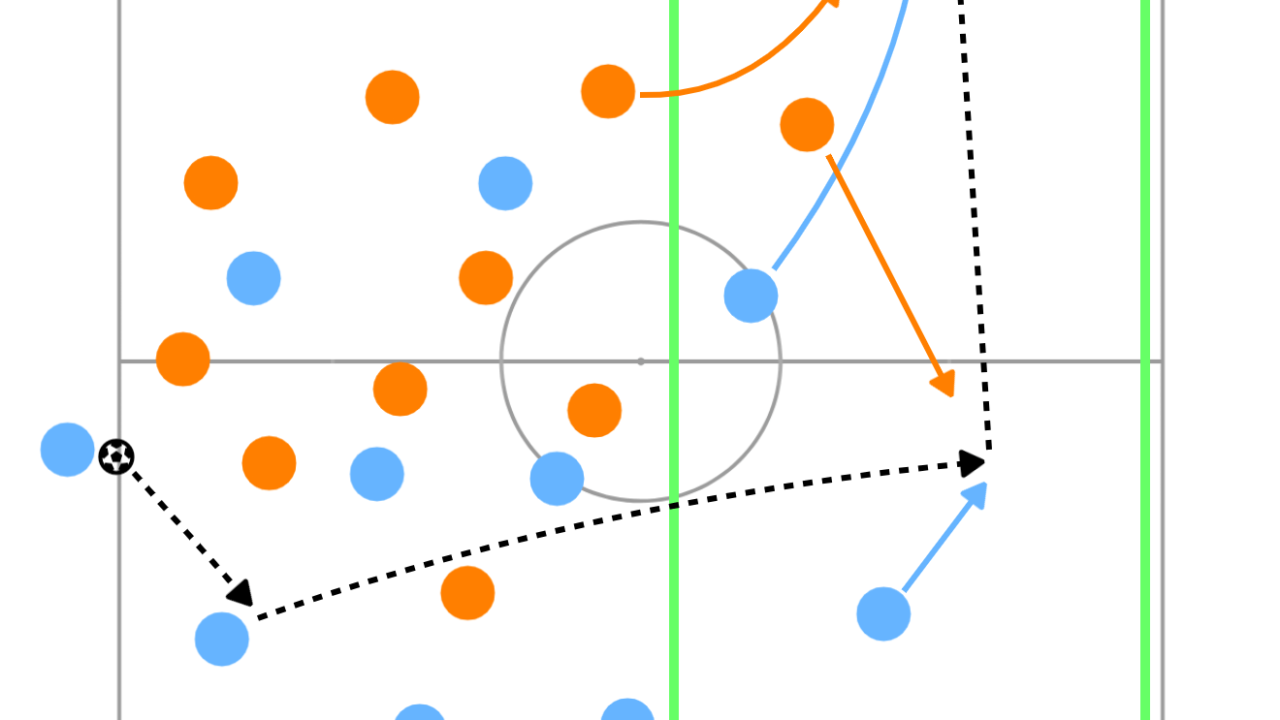
Finally, one of the overlooked factors about throw-in is the transition between the open play and throw-in. the ‘five seconds rule’ which was mentioned earlier is one of them to express the importance of the transition from the open play into throw-in. However, if throw-in was not played quickly and the defending team could organise their shape, throw-in is going to be a truly set piece. In this case, players of both teams are positioned themselves in the ball side with an extremely narrow width. These shapes are completely different from the shapes used in the open play. Therefore, there will be a transition between throw-in and the open play after the ball is thrown, and this is a crucial moment. To change into the usual shape quicker than the opposition is the key. From the attacking perspective, especially, playing to the open space in the opposite side and breaking lines can create a goal scoring opportunity. On the other hands, if the defending team can shuffle over quicker than the attacking team, it is possible to surround the player on the ball as he or she is likely to be isolated and win the ball back. Therefore, the transition from throw-in to the open play should be paid attention more.
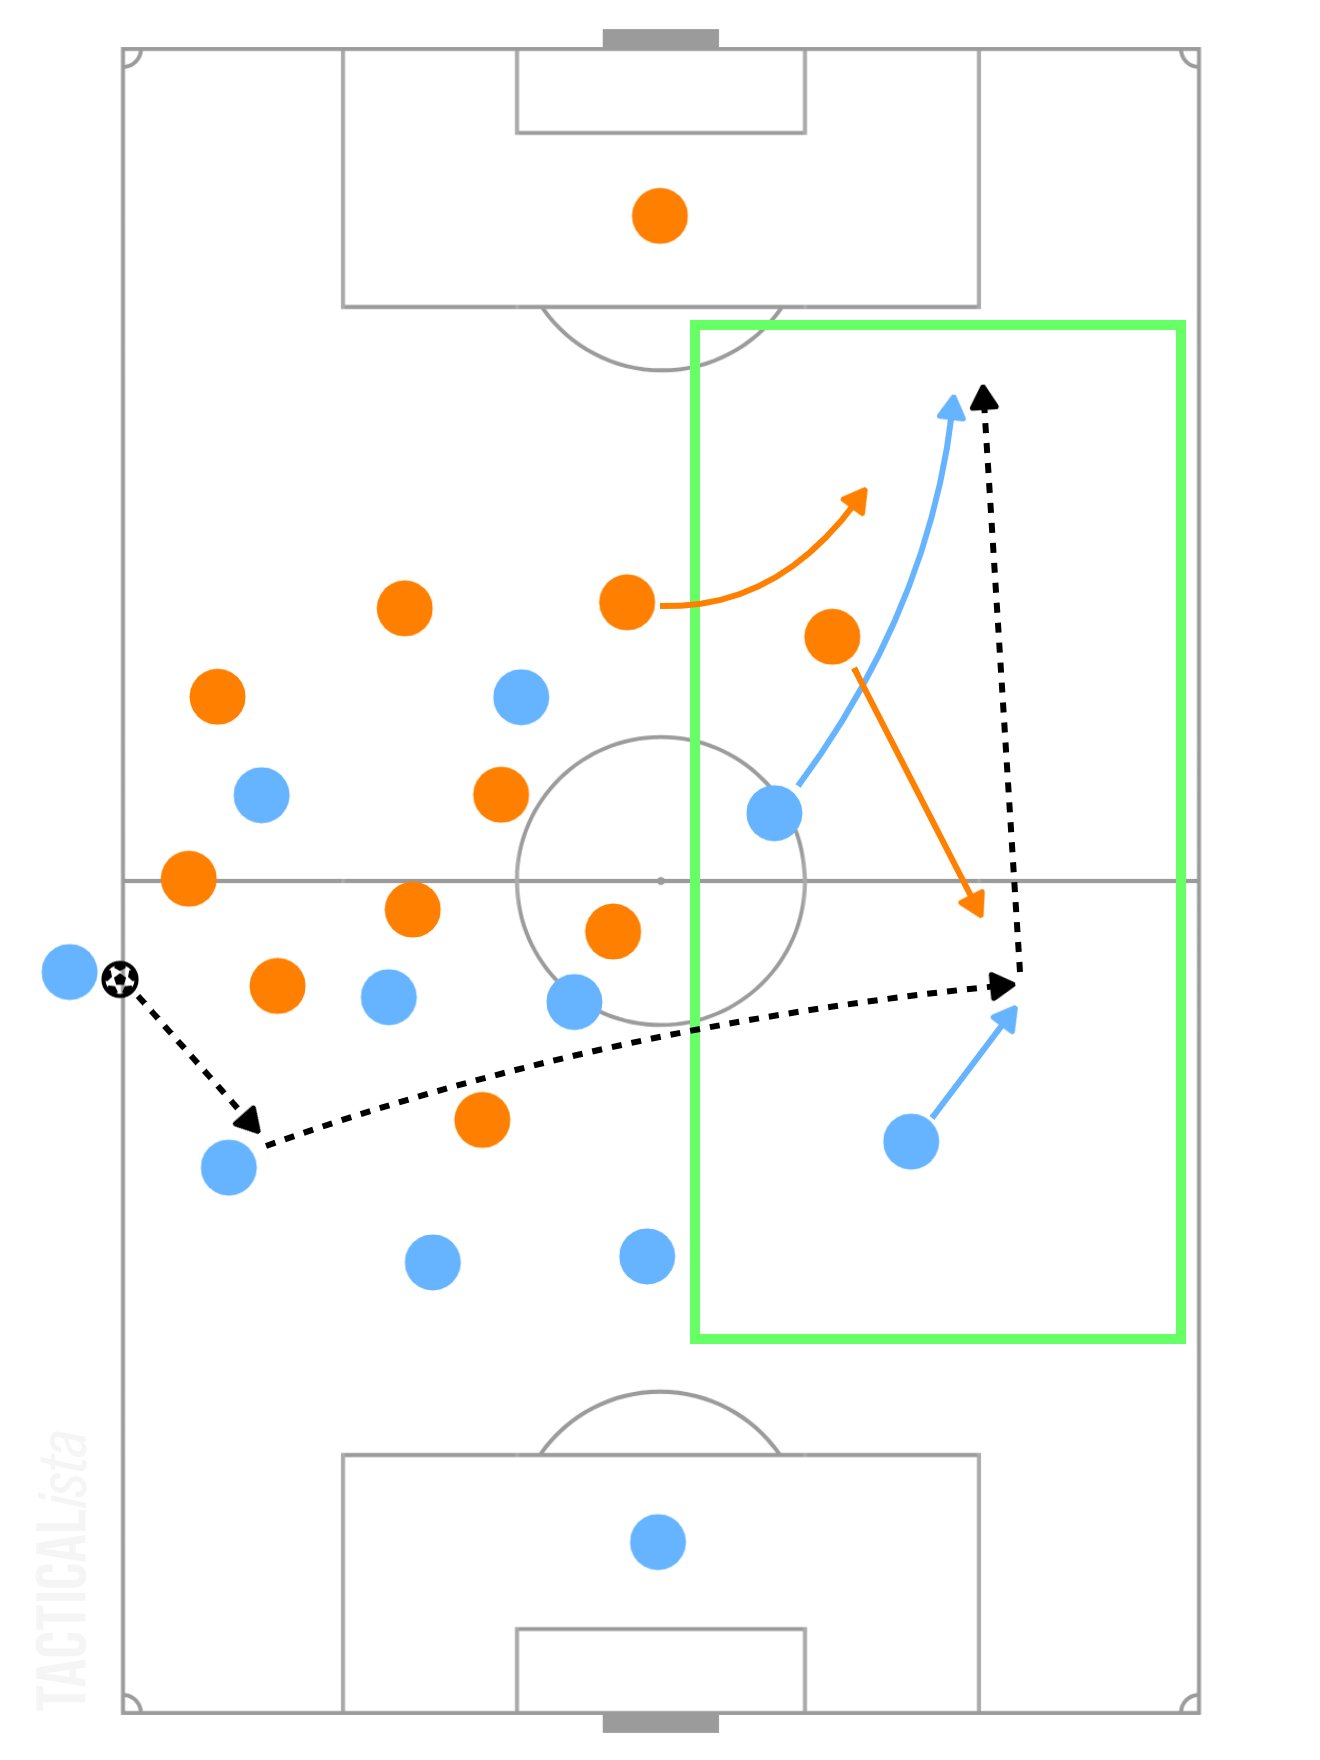
According to Stone et al. (2021), the probability of creating chances of taking a shot is only 6.6% if the ball is thrown forwards, but this can increase to 11.2% if the ball is thrown backwards and 12.2% if the ball is thrown lateral except for throw-in played in the attacking or defensive 18 yard. This suggests that switching the ball away from the pressure and then playing forwards are more effective to create a goal scoring opportunity than throwing the ball forwards. Therefore, it is more efficient to focus on creating chances from throwing the ball lateral or backwards and winning the transition than hopeless and rare long throw.
Conclusion
As it was mentioned in the first sentence, the number of research about throw-in in terms of performance analysis is not enough. Thus, something I would like to research about throw-in is going to be written here.
Firstly, there is a data about the result of the first contact, but it is not sure where the player touches the ball. It is obvious that receiving the ball on feet is much easier to control the ball than heading and flicking it. Therefore, the part of the body to touch the ball from throw-in can determine the play after receiving it. Thus, secondly, the decision making by the player receiving the ball is also insightful. Trying to keep the possession or playing long to avoid risks are completely different ideas. Additionally, the number of plays to keep the possession after receiving the ball can be an important indicator to show whether throw-in of the team is good or not.
Additionally, it must be supported by academic data that there is likely to be a transition after throw-in. This is just a hypothesis and must be investigated further.
Thanks for reading.
References
Augste, C. and Prestel, C. (2021) Tactical actions during opponent throw-ins in soccer in the German Bundesliga. Journal of Physical Education and Sport, 21(4), pp.1846-1852.
Casal, C., Maneiro, R., Ardá, T., Losada, J. and Rial, A. (2015) Analysis of Corner Kick Success in Elite Football. International Journal of Performance Analysis in Sport.
McKinley E. (2018) Game of throw-ins. American soccer analysis. Available at: https://www.americansocceranalysis.com/home/2018/11/27/game-of-throw-ins (Accessed: 16 November 2022).
Stone, J.A., Smith, A. and Barry, A. (2021) The undervalued set piece: Analysis of soccer throw-ins during the English Premier League 2018–2019 season. International Journal of Sports Science & Coaching, 16(3), pp.830-839.
Wiebe, A. (2013) Opta Spotlight: Long throw-ins are en vogue in MLS, and that doesn’t figure to slow down anytime soon. Available at: https://www.mlssoccer.com/news/opta-spotlight-long-throw-ins-are-en-vogue-mls-and-doesnt-figure-slow-down-anyti (Accessed: 16 November 2022)